
Cryptocurrency Markets Stagnate – Where is the Opportunity?
Cracking Cryptocurrency Market Update
September 06, 2022

A happy tuesday to everyone! I hope you enjoyed your Labor Day Weekend. Life is short, and it's important to spend time with those we love and cherish. Always take advantage of the opportunities life gives you to enrich your life and give deeper meaning to it. Life is a choose your own adventure story, and you are in control of turning the pages. You only get one chance, so make every day a day worth living.
The cryptocurrency markets did not give us much in the way of love this holiday weekend. Bitcoin and Ethereum were dedicated to staying flat on low volatility, so not many opportunities for day traders or swing traders. Today is currently a red day in the markets, with Bitcoin down 3.5% in price today currently trading at $19,114 and Ethereum down 1.5% today trading at $1,590.
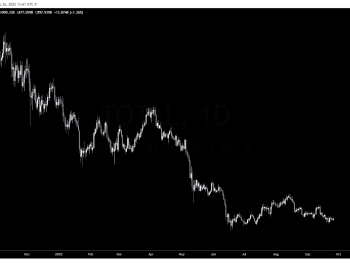
Bitcoin is currently testing it's bottom shelf of support. This price level has held Bitcoin's price three times over the past three months. This makes this area a very obvious horizontal support/resistance level. Because it is very obvious, we can anticipate volatility and predictable behavior. We can either expect price to experience a surge of buying interest and selling absorption here, where being poised as a buyer can be greatly advantageous. We can also see, upon the fourth subsequent re-test of support, a failure of demand to hold up price and a subsequent collapse.
Again, I am reminded of November 2018. Bitcoin had been in a marked decline the entire year, since the blow off top back in December of 2017. Bitcoin finally ground along $6K for what seemed like an eternity. Before it finally slipped, and plummeted down to $3K which did mark the bottom for Bitcoin. Here I am expecting ultimately something similar.
While it is plausible that the overall bottom is in for Bitcoin, and that what we are experiencing now is the beginning/middle of a prolonged accumulation period, on-chain metrics point us to be cautious. There is still no growth of organic demand, new users coming in, new addresses popping up, new money flowing into exchanges. Although long term holders are content to sit with their coins, which is good, the lack of new demand will not be able to prop up price indefinitely.
I believe this is leading us inevitably towards a final capitulation event, which can see Bitcoin tumble all the way down to $13-15K, before our bottom is finally established.
For this reason I am protecting myself by opening up a hedge position on Bitcoin at this price level. As I said, avoiding loss is more important than speculating on potential gains, especially in a market as treacherous as this one. I stated that if we lost this price shelf, I would be protecting myself with a hedge. If we close below $19K, I will be doing so.
Keep in mind, I already have a 2% risk long position that I've pyramided into, from the range Point of Control to current price and I actually just filled my last limit order. I will not be closing that position, I will simply take the loss on that position and let the profits from my short cover and exceed it if all goes well. Bitcoin still has a high probability to bounce from here, although my projections of $30K before $13K are beginning to look bleak.
Let's review our on-chain data to strengthen the argument for our position.

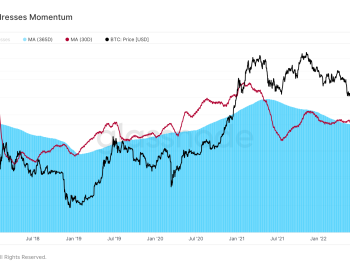
Bitcoin: New Addresses Momentum
This metric tracks the 30 Day Moving Average of new Bitcoin addresses against the 365 Moving Average. What we want to see is the 30 D tracking higher than the 365, indicating that there is an uptick of new users, and thus, new money, flowing into the system.
Currently, the 30D remains below the 365D and is still flat, indicating no new wave of interest at this time.

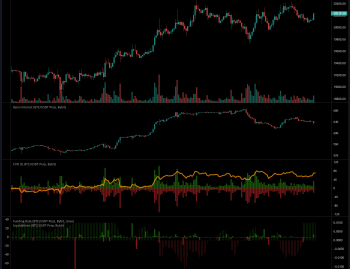
Bitcoin: Exchange Inflow & Outflow (30DMA)
This metric tracks the 30D Moving Average of Exchange Inflow & Outflow. What we want to see is an uptick in flows both ways, indicating more trading activity and more on-chain transactions.
Currently, both Inflows & Outflows are trending downwards, indicating decreasing network and exchange activity.

Bitcoin: Net Realized Profit/Loss (90DMA)
This metric compares the last price a coin was spent at versus the price it is spent at now. If the price spent now is higher than the price spent previously, we assume the coin is moved at a profit. If the price spent now is lower than the price spent previously, we assume the coin is moved at a loss.
This metric lets us know whether, on average, individuals are moving/spending their coins at a profit or loss. Peaks in this metric are a reliable indicator of tops and bottoms, and the slope of the curve lets us know which way the market is moving. This is very helpful for identifying a true market recovery versus a Bear Market Mirage.
Currently, the metric appears to have peaked to the downside. Suggesting that potentially, the bottom is in. The curve is sloping back up, indicating that less traders are spending their coins at a loss. This is what we see in a true recovery. However, over the last week the metric has begun trending back down and more data is needed to give a full picture.

Bitcoin Average Coin Dormancy (7DMA)
Dormancy tracks the average age of Bitcoin moved on-chain. We can see that this metric has been in decline since January 2021. This means that older coins are staying put in their wallets, and that the majority of coins moved on-chain are recently minted Bitcoin.
In a bull market, this is a very positive signal as it shows that older coins are staying put and that long-term investors are not selling. However, currently the reverse is true. Prices are declining even though long-term investors are sitting tight. This futher strengthens our argument that current demand is barely able to prop up the price of Bitcoin at these levels.
We did have a small spike in this metric from August 25th to August 29th, indicating that older coins were sold during that price decline. This is something to watch, if current demand is not enough to prop Bitcoin's price up, we can see a capitulation event marked by the forced selling of old coins.

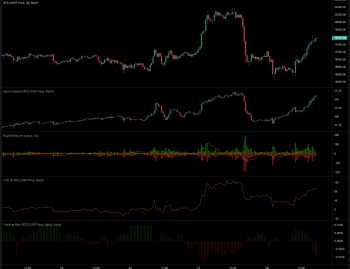
Bitcoin: Adjusted Spent Output Profit Ratio (aSOPR) [7DMA]
This metric tracks the realized value of Bitcoin against the value at which they were received. When this metric is greater than one, it means that on average Bitcoin sellers are locking in profit above their cost basis. When this metric is at one, it indicates that Bitcoin sellers are selling at cost. When below 1, it indicates Bitcoin sellers are locking in losses.
This metric can act as a reliable level of support and resistance in bull and bear markets. In bull markets, investors will often purchase more Bitcoin as price returns to their original cost basis. In bear markets, investors will often sell as price rises to their cost basis, allowing them to get out at break even.
We can see this metric just recently rejected from 1, and we are in a bear market. This lets us know that sellers took the opportunity of exit liquidity on Bitcoin's small rally we just recently experienced to get out, not in profit, but at breakeven. Now we are sliding back down again.

Bitcoin: Net Realized Profit/Loss [7DMA]
This metric is identical to the 90DMA metric above, however here we can see with more granularity recent profit and loss. Currently we can see that Bitcoiners are locking in just a little south of $200 million in losses per day.
")
Bitcoin: Valuation Models
Tracking the evolution of Bitcoin's Delta Price, which currently rests at $13,520. This is our current downside target for Bitcoin's bottom.

Bitcoin & Ethereum: Top Traders Positions and Accounts
Here we look at the top traders positions and accounts across the major exchanges. Will following the big boys pay off or is counter-trading the correct option?
For positions, we can see that the board is split. Roughly half of all top traders are long and roughly half are short for both Bitcoin and Ethereum. This indicates a lack of confidence, and a lot of hedging going on. Interestingly enough, accounts are net long. Although active positions are not, actual holdings of top traders are significantly net long, particularly on Binance.

Altcoin Market Analysis
An overall red day for altcoins, following along with Bitcoin's plunge. The only coins bucking the trend remain LUNC, which has been on a tear lately. RVN, BIT, and ETC are also up for the day.
Altcoins of Interest: Strong and Oversold
Here we track the top ten altcoins of buying interest based on the metrics of having an MVRV score placing them in oversold territory, while also having strong on-chain demand and network activity.
#1 Dogecoin (DOGE)
#2 HEX (HEX)
#3 Uniswap (UNI)
#4 ApeCoin (APE)
#5 The Sandbox (SAND)
#6 Quant (QNT)
#7 Trust Wallet Token (TWT)
#8 Stepn (GMT)
#9 Gala (GALA)
#10 Bitgert (BRISE)
Altcoins of Interest: Exchange Inflow Anomalies
Here we track the top ten altcoins of selling interest based on the metrics of large inflows to exchanges.
#1 Polygon (MATIC)
#2 Chain (XCN)
#3 Paxos Standard (USDP)
#4 Loopring (LRC)
#5 Fei USD (FEI)
#6 Convex Finance (CVX)
#7 Flux (FLUX)
#8 Livepeer (LPT)
#9 Audius (AUDIO)
#10 Storj (STORJ)
Altcoins of Interest: Strong Activity
Here we track the top ten altcoins of buying/selling interest based on a significant uptick of on-chain and exchange volume and daily active addresses.
#1 yOUcash (YOUC)
#2 TerraUSD (USTC)
#3 Hifi Finance (MFT)
#4 Mask Network (MASK)
#5 ONBUFF (ONIT)
#6 Adventure Gold (AGLD)
#7 Selfkey (KEY)
#8 Rupiah Token (IDRT)
#9 Polkamarkets (POLK)
#10 CryptoFranc (XCHF)
yOUcash - It's formed a very artificial price ceiling of $0.50 and has just crept back up there again. Lacking any further information about this token, I would expect resistance to act as expected and push price back down. A sell signal.
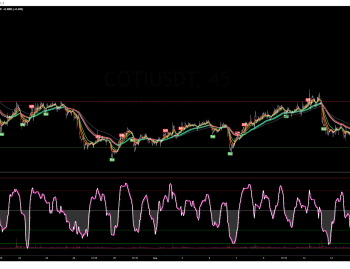
MFT - This is an interesting chart. It's clear that this asset is actually in an uptrend. It recently had a nice price spike with high exchange volume and decent on-chain volume. I would like to be exposed to this uptrend, so I'll be watching MFT for a comfortable pullback price. Will keep you updated.
Mask Network & ONIT - Just experienced a high volume sell off down to new depths. Wouldn't recommend touching this one for now.
AGLD - Big spikes in metrics during a price pump, likely to be sold off.
POLK & KEY - Same as Mask and ONIT.
Summary
Unfortunately, I wasn't able to find any glaring buy signals today. However, I am safely able to avoid buying the tops of pumped assets by being disciplined and waiting for my moment. Follow along with me and you will too.
The cryptocurrency markets continue to stagnate. The current opportunities present themselves in short-term trading opportunities, in the altcoin markets, that last several days and are high risk. Yields in defi have been crushed down to a median of 2%, because new money is not available to artificially inflate yield. On top of that, current demand is dwindling and may not be able to prop Bitcoin's price up much longer. A decline in Bitcoin's price will take the rest of the market out with it to new lows.
If you're excited about cryptocurrency and trading and want to push yourself to the next level, join us in the Premium Trading Group. You will receive exclusive access to additional analysis, trading signals, portfolio recommendations, community and one-on-one mentoring, access to our professional suite of trading indicators, access to our Online Trading Academy, access to our Private Discord and much much more.
Find the right plan for you here!