
Crypto Bulls Salty Tears – Friday Market Wrap Up
What a week ladies and gentlemen! Quite a bit of volatility, but our strategies, both automated and discretionary, were very successful this week. Before we begin with our end of week analysis, first let’s recap how the Cracking Cryptocurrency Trading Group performed this week.
First, let’s look at our discretionary positions, provided to our Members through our Signal Service.

We closed six positions this week, four of which were winners and two of which were losers, giving us a success rate of 66%.
We successfully closed Long Positions on INJ USDT and ALGO (profits here were actually greater due to the fact that we locked our ALGO in Folks Finance Liquid Governance Contract).
We successfully shorted ETHW USDT and BTC USDT.
Our losing positions were a long on BTC USDT and a short on SUSHI USDT.

In summary, with all the positions combined we grew our account balance by 7.44% this week.
Since April of this year, we are up 23.29%, having grown our discretionary account balance from $276,618 to $341,049 in that time period.

Our primary Automated Strategy, Bottom Feeder, successfully closed four Long Positions this week, VET USDT; LTC USDT; XRP USD; and XMR USDT. With our current risk per trade at 1%, our total account growth for this week is 2.28%.

Since Bottom Feeders inception in July of 2020, this strategy is up a total of 76.99%.
Our secondary Automated Strategy, SD DEMA, unfortunately continues its losing streak. We anticipated this, as it is designed for trending markets and therefore tends to lose during ranging and sideways market regimes.

Our SD DEMA Short Only Strategy closed 19 positions this week, 13 of which were losers and 6 of which were winners, giving this strategy a success rate for the week of 32%.The strategy’s account balance has declined by -2.98% over the last week.

Since its inception in December of 2021, this strategy is up 33.41%, giving it a Market Alpha of 192.21%.
Meanwhile, our SD DEMA Long Only Strategy closed 7 positions this week, 2 of which were winners and 5 of which were losers, giving this strategy a success rate of 29% for the week.

The strategy’s account balance has declined by -2.59% over the last week. Since its inception in December of 2021, this strategy is down -2.97%, giving it a Market Alpha of 112.52%.

(If you would like to have access to these strategies and results, subscribe to the Cracking Cryptocurrency Trading Group to gain access to our Signal Service and Indicator Suite!)
Quite happy with our results this week, we continue to look for ways to improve SD DEMA, however our main focus is on optimizing our Mean Reversion Strategy which our current Beta Test shows to be shining in the current market environment. We follow a Performance Based Capital Allocation Schedule, such that when strategies underperform we reduce their capital allocation, and as strategies overperform, we increase their capital allocation.
With our results out of the way, let’s move onto our Market Update!

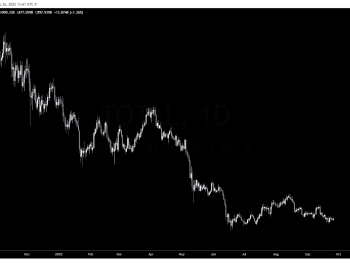
Beginning with the Total Cryptocurrency Market Cap, I wanted to point out the potential fractal playing out in front of us.
This logarithmic chart of Bitcoin gives a starting point of the end of the 2017 Bull Market up to today. Note the similarities.
I’ve drawn best-fit trendlines, and we can notice a similar pattern. In 2018, we were respecting the downtrend until the selling climax that marked the true bottom of the bear market where we deviated below the boundaries of our trendlines. We then recovered to trade back within the trend line structure and formed a higher low. The true end of the bear market was confirmed when we successfully closed above the upper resistance trend line.
Now, in 2022, we can see a similar wave of selling that pushes us into a deviation of the trend line structure. We then recovered to trade back within the trend line structure, and are currently forming a potential higher low. If this plays out, this structure will confirm the end of the bear market when we can successfully trade above the upper resistance trend line.
Strategy Idea: Set an alert for TOTAL Market Cap crossing the upper trendline.

Turning to On-Chain Metrics provided by Glassnode, we will first look at our current Valuation Model, Bitcoin’s Balanced Price and Difficulty Regression Model. This model attempts to calculate a fair market value for Bitcoin and the DRM attempts to calculate the ‘All-In’ cost of mining a Bitcoin.
")
As you can see, Bitcoin’s Market Price is still hovering above both of these metrics, where we see a rare convergence of these two metrics in-line with actual price action.
Note that Balanced Price successfully predicted the market bottom back in 2018, we wait to see if it can successfully call such a bottom again.
")
In the event that it cannot, and that macroeconomic forces outweigh, for the first time in history, the strength of these predictive models, we turn to our broader Valuation Model, Bitcoin’s Delta Price.
Delta Price successfully captured the actual bottom wick back in 2018, and it sits currently at $13,137. A long way to go indeed if we lose our current price floor.

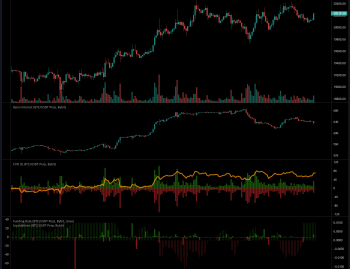
On a more positive note, we look at the Percent of Bitcoin Supply in Profit. Historically, when we are below 50% on this metric it has been an indicator for a market bottom. While we have dipped our toe below that line, we have yet to take the full plunge as we have seen has been necessary for previous bear markets to conclude. This helps to confirm the fact that we are in the later stage of this bear market, however, there still seems to be more room for downside decline.

Next, we look at Net Realized Profit/Loss (90DMA). Historically, when this metric reaches a peak low and begins climbing back up, it has been a signal of the end of the bear market and the beginning of a new Bull Market.
That is exactly what we see from this metric, and as such, it stands in contrast to every other metric we’ve observed that suggests although we’re near the end, it’s not the end of the road yet. Time will tell if this metric makes a new peak low before the warm light of the bull market shines upon us.

Finally, the most exciting metric: New Addresses Momentum. This tracks the amount of new Bitcoin addresses, comparing a 30D moving average with a 365D moving average. Historically, when the 30DMA overcomes the 365DMA, it is a signal of a fresh bull market, as the amount of recent new network participation is overcoming the yearly baseline.
This indicates that new network participants are becoming active on-chain, and this is a requirement for fresh inflows of capital into the market, the primary catalyst of a bull market.
This metric is very encouraging, as we are climbing back up very consistently from our current downtrend and we are on the cusp of overcoming the yearly baseline.
Strategy Idea: Set an alert for 30DMA climbing higher than 409,470, the current value of the yearly baseline.
Bitcoin Analysis

Starting with the weekly chart, Bitcoin is still grinding its current consolidation area in a macro downtrend. What is most concerning is the large airgap of liquidity below $18,000. That area is a Low-Volume Node (LVN). We know fundamentally that price, once it deviates from a High-Volume Node (HVN), tends to cut through LVNs like a hot knife through butter.
We don’t enter another HVN until $12-13K, confirming the significance of that area revealed by our Bitcoin Delta Price.
While it remains plausible that the bottom is in and we have already entered the accumulation phase of the market, most signs currently point to a lack of confidence in this projection. Therefore, from the standpoint of the investor, while these prices are currently attractive, the long-term risk is not relatively attractive. We maintain our recommendation of no-more than 25% allocation of desired total allocation to Bitcoin at this time.

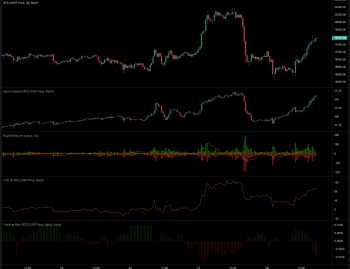
From the Daily Chart, we can see Bitcoin rejecting from the current range Point of Control. We remain locked within a HVN, with a small airgap above us that ends at $21,160. If we can successfully trade above $20,363 we maintain a high level of confidence that breakout positions to $21K will be quite successful. As it sits, no daily swing positions are warranted at this time, and our current level of support is at the $18,700 level.

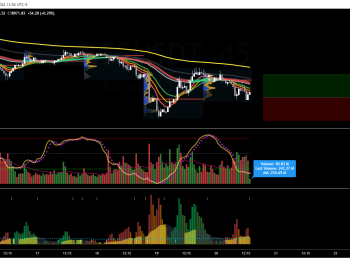
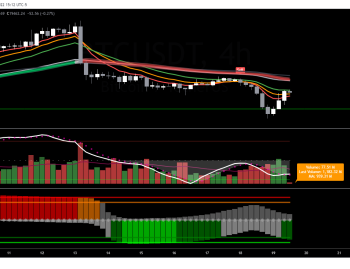
The four hour chart has been the most helpful for timing our meso swing positions. We can see that Bitcoin deviated slightly above the current Value Area, the top of our current HVN, before accepting back within the value area. We plunged through that small airgap LVN and are currently descending to this timeframe’s Point of Control at $19,100. Meso swing short positions we recommended can be held open, however we recommend some profit taking and stop loss updating at this time. Set sights for $19,100 and $18,700.
Summary
Bitcoin’s price action remains volatile and trading for most retail and discretionary traders continues to be a lesson in humility. Macro conditions are still deteriorating, and while foreign governments have pivoted to some QE to ease their currency crisis, risk markets have so far responded net positively.
Today’s price decline puts that in question, as we see yet again, elevated prices being taken advantage of by Short-Term Holders to lock in profits, blowing the wind out of the sails of the bulls.
All on-chain metrics confirm we are in the late stage of the bear market, but whether the bottom is in or not remains to be seen. Proceed with caution.
If you’d like to diversify your approach to cryptocurrency trading and investing, there’s no better place to become a better trader and improve your performance than the Cracking Cryptocurrency Trading Group.
Come join us in our quest to conquer the markets, one position at a time!