
Traders Mourn A Down Day For Bitcoin As Markets Tumble
Important Cryptocurrency Market Snippets
- Reddit’s MOON cryptocurrency exploded over news that community admins plan to fully decentralize the token and impose a hard cap on its supply.
- XRP’s price surged, then crashed, on reports of a “BlackRock iShares XRP Trust” filing that turned out to be fake.
- Blockchain Association warns that the definition of broker in a proposed federal tax rule could destroy the U.S. Defi industry.
Top Cryptocurrency News Today


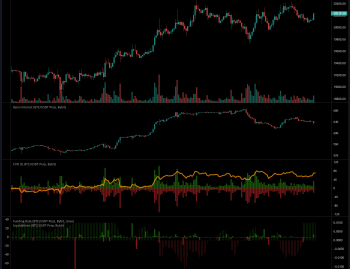
Bitcoin Analysis
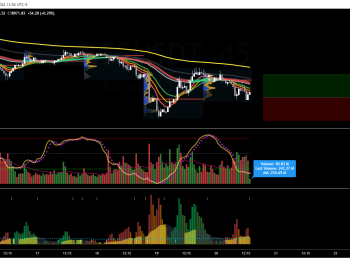
It is a down day for Bitcoin, as prices have slid nearly -3.5%.
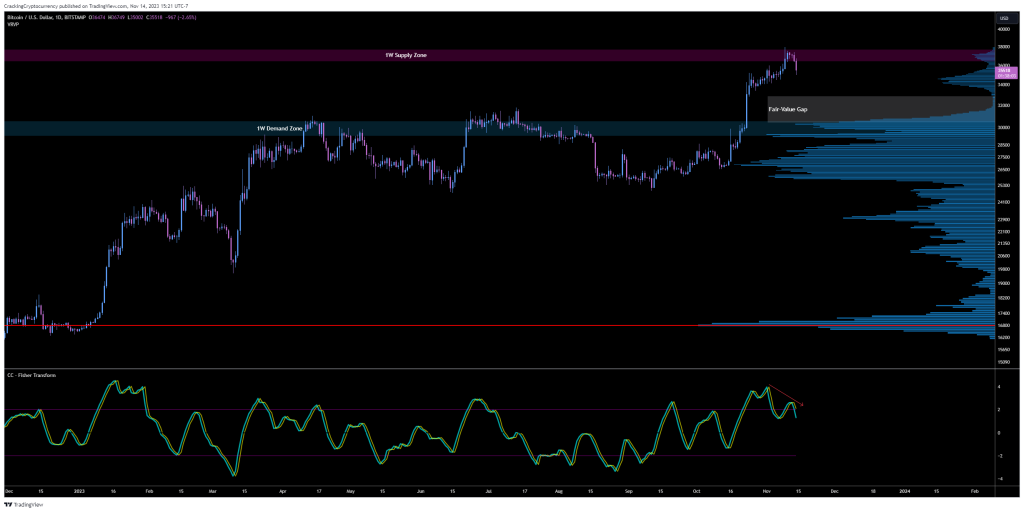
As noted in yesterday’s Market Update, Bitcoin’s price has reached an important Weekly Supply Level. Therefore, our current pullback is well anticipated.
Two potential scenarios present themselves:
- Bitcoin continues its descent towards our Fair-Value Gap, approx. $30-$32K.
- Bitcoin re-tests our Weekly Supply Zone before filling the gap.
Of these two, scenario 2 is the most likely.
Analyzing nearly every previous Bitcoin price movement of this year, it is extremely rare that Bitcoin puts in a medium-term trend shift without a re-visit or the relevant Supply/Demand Zone that triggered the trend shift.
Conservative traders can continue to trim long profits, waiting on the sidelines to see if Bitcoin reacts bullishly from the Fair-Value Gap or breaks out above our current Yearly High.
Aggressive traders can target a movement back up to resistance and potentially even consider flipping short upon reaching the target to be prepared for the movement down to fill the gap.
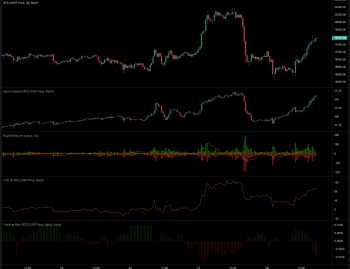
U.S. Dollar Currency Index DXY Analysis
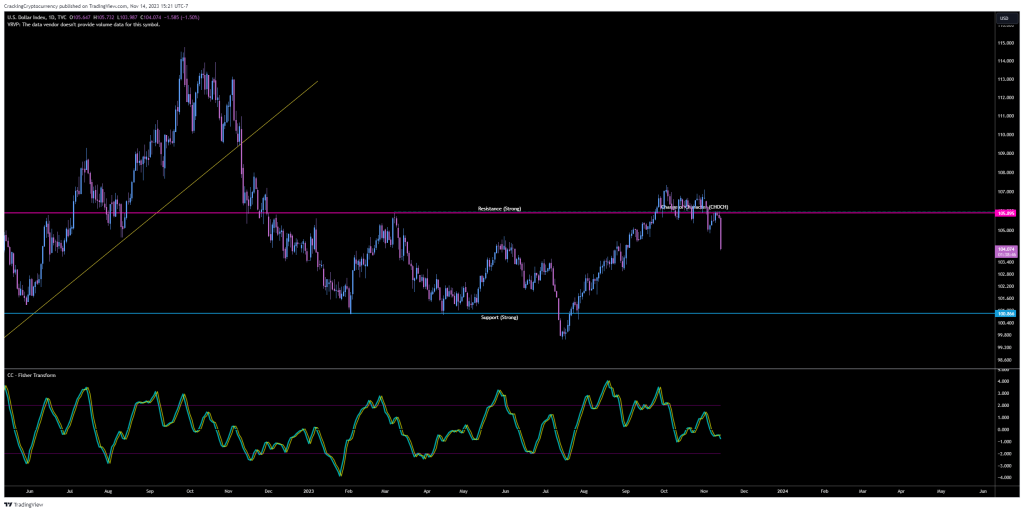
A compelling movement downwards from the DXY today.
As a risk-on trader and investor, I typically look for contrary signals on the DXY to help guide my swing trades in the stock market and cryptocurrency.
It’s important to note that the DXY has been a powerful trending index to monitor and chart, and its trend shifts have paid dividends to those willing to analyze them.
In simple terms, if the DXY is in a bullish trend, then risk-on assets will be in a bearish trend. The same applies vice versa.
Of course, there are always exceptions to the rule. However, this general guideline can be an excellent bedrock for discretionary and systems traders looking for a fundamental edge in their strategy.
At first glance, it may appear that DXY has had a failed breakout and has fallen back into the yearly trading range.
While that is true, it is essential to note that this recent index action forms what Smart Money Traders would call a ‘change of character’. This is when an asset makes a higher high or higher low, breaking the mold of the previously established trend.
Therefore, we can see that the DXY recently put in a Change of Character by making a higher high, breaking out of the previously established mold of Lower Highs and Lower Lows.
Therefore, we presume that risk assets will do well while DXY is trending down. It does seem that today that doesn’t apply, as Tuesday has been a down day for everything. I am currently unaware of the catalyst or cause of this behavior.
However, as long as DXY continues to trend down, we anticipate continued bullishness in risk-on assets.
However, let’s pay very close attention to what DXY does.
Should it form a higher low, after putting in a Change of Character, the next swing we can expect would be a Higher High.
Thus, we could tentatively anticipate a week or two of continued bullishness, a Higher Low on the DXY, and a sharp correction in risk-on assets.
Trade safely, and as always – let analysis and data guide your trading decisions – never emotion.