USDT Dominance

USDT Dominance

USDT Dominance continues to trend down, indicating capital is continuing to rotate out of stablecoins and into risk-on assets. On its face, this is a bullish sign that indicates we can continue to see broad price appreciation across the cryptocurrency markets.

Things to note and prepare for: USDT Dominance IS at a critical support level. USDT Dominance has reversed from this Demand Zone many times since it was established in the Summer of 2022.

Should USDT Dominance reverse here, it would indicate a capital rotation back into stablecoins and the beginning of a decline in prices across the cryptocurrency markets.

However, should USDT Dominance instead crash through this Support Area, expect big Jericho Candles to erupt across your favorite tokens.

Recommendations: Holding long positions for swing/positional trades is fine. However, consider trimming/closing positions upon a USDT Dominance reversal.

TOTAL Cryptocurrency Market Capitalization

The cryptocurrency market’s capitalization has rightfully exploded in the past month, adding over 1/3rd of a Trillion dollars to the value of the market.

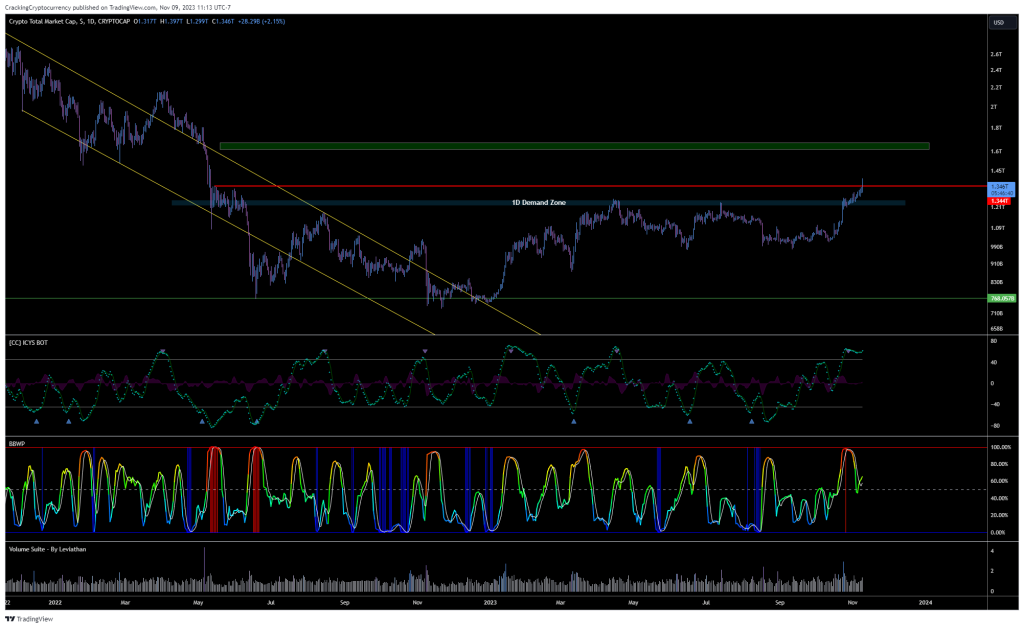
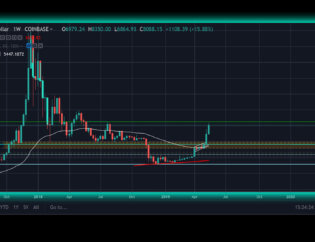
Market Cap. exploded through our previous resistance area and has now ventured into a Low-Volume Node on the VRVP Indicator. Low-Volume Node zones are prone to high volatility and explosive movements due to the lack of previous demand or liquidity in that zone.

We have hit our final level of resistance, the high from a previous consolidation area created during the bear market of 2022.

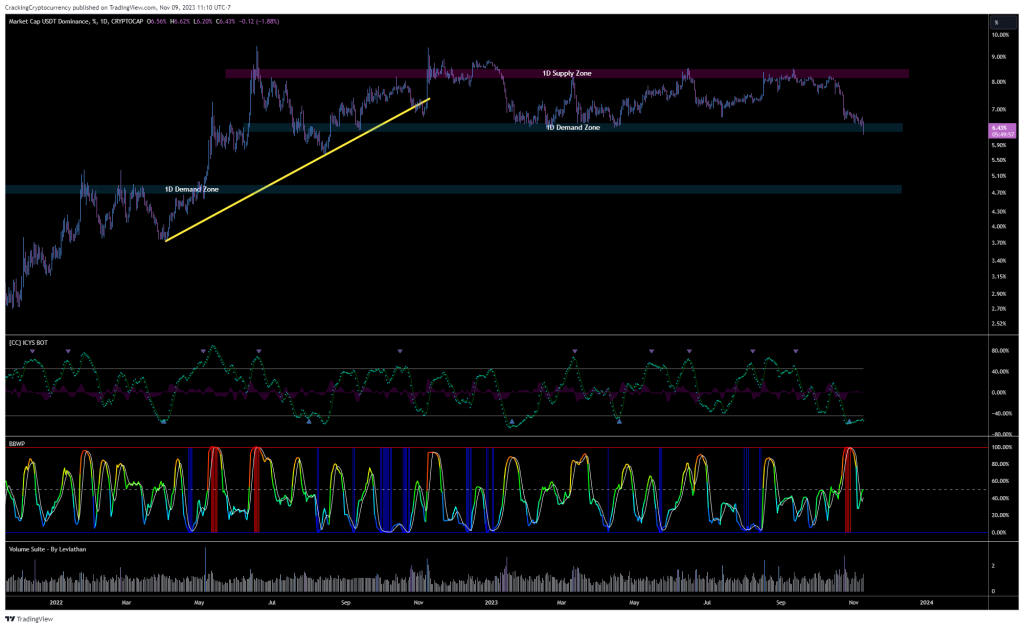
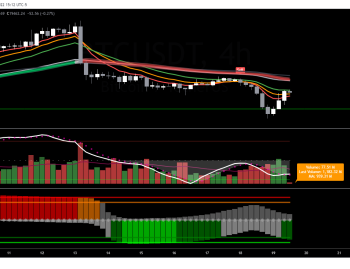
I noticed an interesting pattern from my momentum oscillator, ICYS Bot, which modifies our most popular indicator Mynx. Each time it has flashed an Overbought Sell Signal, market capitalization has continued to pump, but not much. It puts in a final leg up before a significant correction.

You can see this play out in October of 2022, January of 2023, and just now in October of 2023 as well. In each previous case, Market Cap has continued to put in a final upthrust before a correction.

I would tentatively anticipate and prepare for a correction here. If we see Market Cap hold the 1.2 Trillion level (the previous resistance we just broke through), then our next target would be 1.6 Trillion, as indicated by the target on the chart.

However, a loss of that level instead would be the first confirmation of a market-wide correction moving into early next year, which would align with our 4-Year Cycle Thesis and Market Projection.

Reccomendations: Consider trimming or closing Long Positions if Market Cap rejects the current resistance. However, long-term positional or swing-trades can be left open until we receive confirmation of whether Market Cap continues upwards from its broken resistance or falls back into the 2023 trading range.

Bitcoin BTC

Huge sell-off overnight. Price dumped very quickly within two hours, nearly 8%, only stopping after wicking thoroughly through our previous broken resistance turned into a Demand Zone.

Unfortunately, such a significant sell-off usually indicates trend exhaustion, so after an initial bounce-back, my strategy is to short back down for a re-test or breakdown of the $35,900 Demand Zone.

I will begin looking for entries around $36,800, waiting for lower-time frame entry signals.

Solana SOL

Sold SOL short this morning. Targeting a re-test of the current Point of Control.

Trade Log Updates

1. Closed out our NEAR USDT (CC23SEP043) Long Position for a 22.67% gain.
2. Closed out our BTC USDT (CC23SEP045) Long Position for a 17.82% gain. Big trade at 10% risk!

by:

Leave a Reply

Your email address will not be published. Required fields are marked *

This site is protected by reCAPTCHA and the Google Privacy Policy and Terms of Service apply.

The reCAPTCHA verification period has expired. Please reload the page.