
Our Strategies Caught The Big Dips – And Now We’re Buying Bitcoin
Cracking Cryptocurrency
Market Update
August 26, 2022
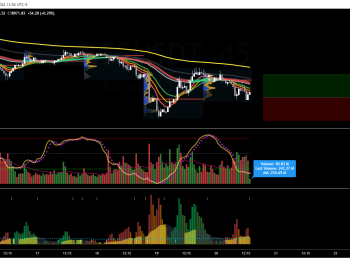
A red day in the cryptocurrency markets, with Bitcoin trading below the local Point of Control. Now 21,400-21,500 is expected to act as overhead resistance rather than support. Ethereum and Altcoins are following right along, showing the power of correlation in the current environment.
Nominal Volume (Volume measured in USD) still remains quite high on major exchanges for Bitcoin, indicating that there is still a lot of spot buying occurring, making this a juicy spot for accumulation.


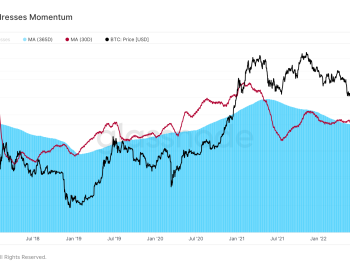
Bitcoin remains in the vicinity, and currently underneath, the 200 Weekly Simple Moving Average (SMA), as well as Bitcoin's Realized Price Valuation Metric. Both have proved to be historical bottoming areas for Bitcoin, however please note that we can trade lower and remain in line with historical patterns.
In previous bearish downturns, Bitcoin has wicked down below the 200 Weekly SMA by as much as 50%. Another hybrid onchain/technical Valuation Model, Bitcoin's Delta Price, has historically caught these wicks.
Note, that currently Bitcoin's Delta Price sits at $14,000. As such, we assign a high confidence interval to the trade setup of placing limit bid orders for Bitcoin down at that price.

Interesting to note here that the balance of Bitcoin on exchanges continues to fall, and the seven day moving average of Net Transfer Volume, a metric measuring the flow of coins into/out of exchanges is net negative, increasing in strength during this latest drop.
This indicates that more Bitcoin is flowing out of exchanges than onto it. This gives strength to our thesis that the current area is a buying zone, rather than a selling zone.


MVRV Ratio (30D SMA) is sitting at -10.09%, indicating that positioned traders who bought Bitcoin over the last 30 days are experiencing a 10% drawdown. Generally, short term traders tend to take profits and suffer losses around these ranges due to their short-term nature.
A continued drop down into our accumulation zone should exacerbate this and set the stage for a trend reversal.
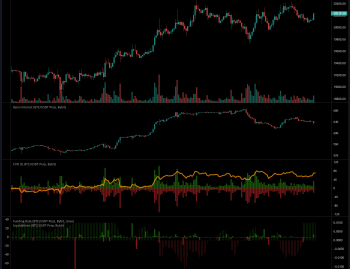
![Bitcoin (BTC) [13.42.09, 26 Aug, 2022]](https://crackingcryptocurrency.com/wp-content/uploads/2022/08/Bitcoin-BTC-13.42.09-26-Aug-2022.png "Bitcoin (BTC) [13.42.09, 26 Aug, 2022]")
Funding remains dominantly negative, indicating an overall short sentiment from positioned traders. We will be watching for drops in open interest as Bitcoin falls into our accumulation zone to indicate the closing of these positions. Also on the table, if price reverses here quickly and begins to head up, we have a situation where the majority of traders are positioned short, setting up a potential short squeeze opportunity.

To strengthen this idea, we note that the Estimated Futures Leverage Ratio, a metric that attempts to calculate how levered positioned traders are has skyrocketed. This metric indicates that traders are assuming higher than normal levels of leverage to make larger bets, and since the majority of traders are positioned short, we know that this leverage is applied to the sell side.

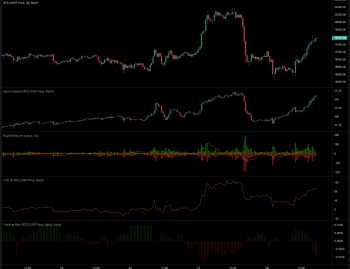
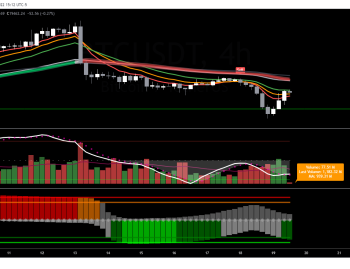
Daily Timeframe Charts are signaling a short bias. Momentum oscillators remain in bearish territory. Mynx is in the bearish control zone, and hinting at a potential crossunder of the signal line, which would be a short sell initiation given that price remains underneath the daily Base Line. Parallox confirms the short trade, and Waddah Attar Explosion is giving a green light for trades.
The only mitigating factor is how both Mynx and Parallox were just oversold. Personally, I am avoiding this daily short signal, however if your system tells you to short here, I would halve my risk.

Four Hour Timeframe Charts along with our standard Pathways to Profit trading system have done quite nicely. Note that Mynx, Waddah, and Parallox combined caught both significant short sell opportunities displayed on the chart. Although current price is in an active four hour short, note that Parallox has just gone oversold, an indication to begin looking for exiting opportunities.
As such, I do not advise a four hour short entry at this time. Rather, look to scale out of your current positions, move your stop loss to break even, and ride the wave if it emerges.

30 Minute Timeframe Charts reveal that Bitcoin has had a surge of volume down here at the lows on this recent dump. This coincides with a previous significant support zone. High Volume + Support general are a high conviction reversal play. Therefore, the best positioned trade today is a long trade, scooping up Bitcoin's price at a discount for re-tests of potentially 23,000.

Ethereum may be played similar to Bitcoin.
HUSD, a Huobi issued stablecoin may be in trouble. Between August 17th and August 18th, HUSD lost peg and dropped to a low of $0.875. Although it quickly recovered it's peg, on-chain data shows that there are Age Consumed anomalies occurring on-chain.
Note in the chart below the metric Age Consumed applied to the price chart of HUSD. Significant spikes in the red line at the bottom indicate large movements of coins that were previously idle. You can clearly see that toward the beginning of June 2022 up to the beginning of August 2022, large amounts of previously idle coins were moved around on-chain. What occurs shortly after that? That's right, the depegging.
![HUSD (HUSD) [13.47.51, 26 Aug, 2022]](https://crackingcryptocurrency.com/wp-content/uploads/2022/08/HUSD-HUSD-13.47.51-26-Aug-2022.png "HUSD (HUSD) [13.47.51, 26 Aug, 2022]")
Current altcoin projects that are strong and oversold. By strong, we mean strong on-chain activity, and by oversold we mean a significantly negative MVRV Ratio, indicating a potential buying opportunity. In order of strength.

Current altcoin projects to avoid buying currently. This metric is calculated by looking at abnormal exchange inflows.

Additional altcoins to sell currently if you hold: Viberate (VIB), Nestree (EGG), & Voyager (VGX). These sell signals are generated by a comparison of Trading Volume, Daily Active Addresses, and On-Chain Transaction Volume.
Thank you so much for finishing this Market Update. Please share this link and for more analysis, please check out our Premium Trading Services.