
HODLERS are HODLING – But The Bears Aren’t Deterred
Bitcoin Futures and Options Metrics
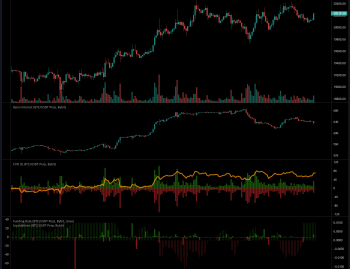
Funding Rate:
Funding remains negative across the Bitcoin market. This tells us that the majority of traders are positioned to the short side and must pay longs for the privelage of holding their positions open.
")
Leverage Ratio:
This metric tracks the ratio of open interest in futures contracts versus the exchange balance of that exchange. This suggests when traders are using more leverage, and as such, when we can expect heightened volatility and market swings.
Currently, the leverage ratio is rising. Indicating that more traders, particularly those to the short side, are increasing their use of leverage. If price reverses here, it sets the stage for a potential short squeeze.

Options Open Interest Put/Call Ratio: BTC
This metric tracks the ratio of Puts to Calls for open options positions.
Currently the Put/Call Ratio is 0.53, indicating there is roughly twice as many Calls (bullish bets) open than Puts (bearish bets). The options market is suggesting that the Risk/Reward trade here is to the long side.

Options ATM Implied Volatility: BTC
This metric tracks the implied volatility of options contracts that are At The Money, indicating that they have intrinsic as well as extrinsic value due to the fact that they are currently in profit.
One week volatility took a sharp dive today to 60.62% for weekly contracts. This is important as volatility increases when their is fear of significant downside. A drop in IV suggests that traders are less worried about downside, and the Put/Call ratio suggests along with this the trade might be to the upside.

Bitcoin On-Chain Metrics: Bear Market Recovery
The purpose of this section is to track key on-chain metrics for the Bitcoin blockchain that indicate the strength of the network and thus the health of the market. This can be used to identify turning points, strengthen investment thesis, or make better informed trading decisions.
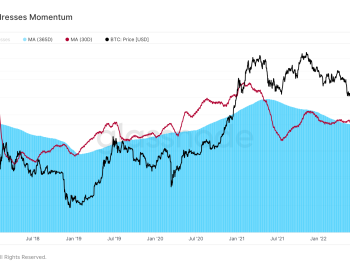
BTC: New Address Momentum
This metric tracks the 30 Day Moving Average of new Bitcoin addresses against the 365 Moving Average. What we want to see is the 30 D tracking higher than the 365, indicating that there is an uptick of new users, and thus, new money, flowing into the system.
Currently, the 30D remains below the 365D and is still flat, indicating no new wave of interest at this time.

BTC: Exchange Inflow & Outflow (30DMA)
This metric tracks the 30D Moving Average of Exchange Inflow & Outflow. What we want to see is an uptick in flows both ways, indicating more trading activity and more on-chain transactions.
Currently, both Inflows & Outflows are trending downwards, indicating decreasing network and exchange activity.

BTC: Net Realized Profit/Loss (90DMA)
This metric compares the last price a coin was spent at versus the price it is spent at now. If the price spent now is higher than the price spent previously, we assume the coin is moved at a profit. If the price spent now is lower than the price spent previously, we assume the coin is moved at a loss.
This metric lets us know whether, on average, individuals are moving/spending their coins at a profit or loss. Peaks in this metric are a reliable indicator of tops and bottoms, and the slope of the curve lets us know which way the market is moving. This is very helpful for identifying a true market recovery versus a Bear Market Mirage.
Currently, the metric appears to have peaked to the downside. Suggesting that potentially, the bottom is in. The curve is sloping back up, indicating that less traders are spending their coins at a loss. This is what we see in a true recovery. However, over the last week the metric has begun trending back down and more data is needed to give a full picture.

Pathways to Profit Algorithmic Strategy
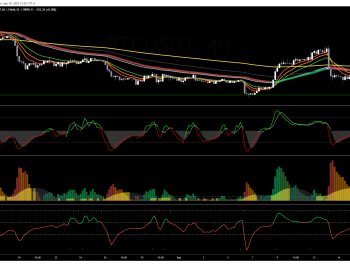
Daily Timeframe:
Bitcoin on the daily timeframe remains below the daily base line. This suggests that we do not have significant upside momentum at this time. No dominant uptrend has yet been established. The strategy signaled for two potential daily short sells on Bitcoin over the past two weeks.
Currently, we have waning momentum from the Waddah Attar Explosion indicator. This suggests that open short positions should be scaled out of, or at the very least 50% profit should be taken and stop losses moved to break even.
Mynx is below the zero line, indicating a short bias. However, we have crossed back above the signal line. This similarly suggests that shorts should be scaled out of. Watch for another crossunder of Mynx and the signal line for a continuation short signal.
Parallox is below the zero line, indicating a short bias.
For daily timeframe long signals, Bitcoin's price must break above 22.882.
For daily timeframe short continuation signals, Mynx must cross back below the signal line. Alternatively, one can use Waddah Attar Explosion - a rising Explosion Level and negative momentum above the signal line would be sufficient.

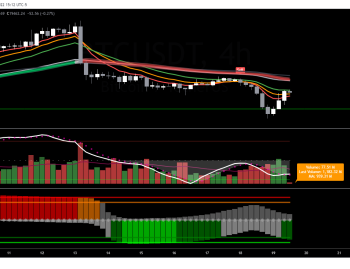
4 Hour Timeframe:
Bitcoin on the four hour timeframe remains below the 4HR Base Line.
Mynx is in positive territory, therefore we will need to cross back below the zero line to signal a short position.
Waddah Attar Explosion is also in positive territory, however the next candle may give us negative momentum. However, I doubt we will see a rising explosion level.
Parallox is also in positive territory. We will need to see it cross back below zero to initiate a short confirmation.
In summary, the four hour timeframe is suggesting no action should be taken at this time.

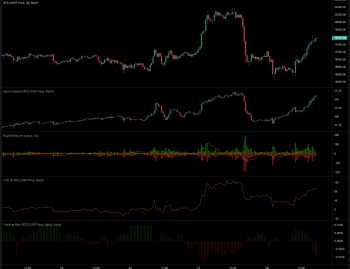
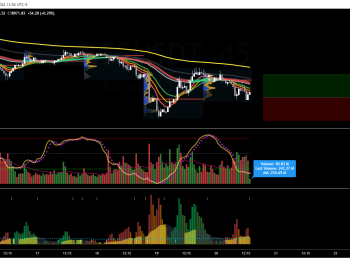
30 Minute Timeframe:
Bitcoin on the 30-minute timeframe is in an active short position.
As you can see in the chart, we crossed below the Base Line, Mynx was below zero, Parallox was below zero, and Waddah Attar Explosion showed negative momentum with a rising explosion level.
The first take profit for this position has already been reached.
Also note, that Mynx and Parallox have reached oversold conditions.
In summary, the 30 minute timeframe is in an active short position. Recommended action would be to take 50% profit and move your stop loss to break even. You can also consider closing more of the position given that Mynx and Parallox are in oversold territory.

Cryptocurrencies of Interest - Buy Side (Strong and Oversold)
Here I track the top coins that are potential buys. This is evaluated through Santiment on the basis of having MVRV Ratios that are oversold, along with strong on-chain activity. This generally indicates accumulation and warrants further investigation.
#1 - Bitcoin (BTC)
#2 - Ripple (XRP)
#3 - Dogecoin (DOGE)
#4 - HEX (HEX)
#5 - Wrapped Bitcoin (WBTC)
#6 - Uniswap (UNI)
#7 - Bitcoin Cash (BCH)
#8 - ApeCoin (APE)
#9 - Decentraland (MANA)
#10 - The Sandbox (SAND)
Cryptocurrencies of Interest - Sell Side (Exchange Inflow Anomolies)
Here I track the top coins that are potential sells. This is evaluated through Santiment on the basis of significant exchange inflows deviating from the norm. This indicates a large rush of coin deposits, which is generally an indication of investor sentiment to sell.
#1 - The Sandbox (SAND)
#2 - TrueUSD (TUSD)
#3 - Fei USD (FEI)
#4 - Gnosis (GNO)
#5 - Holo (HOT)
#6 - Compound (COMP)
#7 - Convex Finance (CVX)
#8 - Livepeer (LPT)
#9 - SKALE Network (SKL)
#10 - SushiSwap (SUSHI)
Note that The Sandbox (SAND) appears in both exchange inflow anomolies and strong and oversold. Also note that two stablecoins are experience inflow anomolies, which is usually a more bullish sign than bearish.
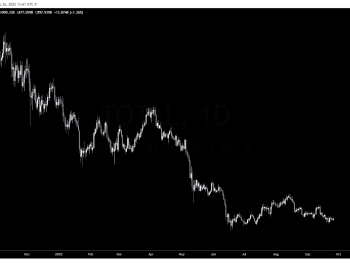
Notable Mention:
Stafi FIS/USD
FIS is the governance token of the Stafi protocol. It's also used for staking and minting rTokens. This protocol runs on the Polkadot ecosystem. I've added FIS to my watchlist due to a large spike in Daily Active Addresses last week. Trading volume is starting to pick up as well, and there has been an interesting explosion of consistent On-Chain Volume beginning at the beginning of June 2022.
While I'm not taking any action currently, I will be watching FIS for more spikes of these important metrics.
![Stafi (FIS) [11.22.52, 30 Aug, 2022]](https://crackingcryptocurrency.com/wp-content/uploads/2022/08/Stafi-FIS-11.22.52-30-Aug-2022.png "Stafi (FIS) [11.22.52, 30 Aug, 2022]")

Recommended Portfolio:
Bitcoin 10%
Ethereum 15%
Altcoins 5-10%
Stablecoins 65-70%
Recommended Positions:
Long exposure on Bitcoin and Ethereum. Mild long exposure on altcoins.
Yield Opportunities:
THALES/USDC on Velodrome. Use Velodrome on the Optimism network, deposit equal amounts THALES and USDC. You will receive 117% APY paid out in VELO tokens. This yield is currently stable and trending up. There is currently over half a million in TVL in this pool, so plenty of liquidity.
PEEL/BUSD on PancakeSwap. Use PancakeSwap on the BSC network, deposit equal amounts PEEL and BUSD into the pool. You will receive a base APY of 23.93% and an additional 72.09% paid out in CAKE tokens. This yield is stable and trending up and there is 1.2 million in TVL in this pool.
Summary:
While we are yet to see any significant on-chain recovery, and current demand is barely able to keep pace with daily sell side pressure, there are still many opportunities and silver linings to the current market. A dedicated trading strategy is your sword and shield in these areas, and we recommend spending the current time cultivating that skill.
If you're excited about cryptocurrency and trading and want to push yourself to the next level, join us in the Premium Trading Group. You will receive exclusive access to additional analysis, trading signals, portfolio recommendations, community and one-on-one mentoring, access to our professional suite of trading indicators, access to our Online Trading Academy, access to our Private Discord and much much more.