Welcome everyone,
Here you can see the extra webinar series content from the Cracking Cryptocurrency Academy! Our team has carefully assembled our curriculum to educate our students on the most relevant concepts and lessons to building a profitable trading strategy. Learn how to manage your risk, position size properly, understand the intricacies and nuances of derivatives and futures contracts, and build a strong foundation for your technical analysis. All lessons are covered with audio and video lectures, as well as accompanying spreadsheets, slideshows, and additional information to ensure a comprehensive education. All of these lessons and more are available with membership to the Cracking Cryptocurrency Premium Trading Group, in addition to our Pathways to Profit Strategy Building Course, Proprietary Strategies, and Indicator Suite.
If you're not a Premium Member
Check out the info on how to gain access to the Premium Trading Academy!
You will receive a message in discord and email with links for accessing this In-House created webinar series. If you have any questions, you can the live chat here on the website in the bottom right corner, send a facebook message on our page, or email Support@CrackingCryptocurrency.com!
BitMEX 101 & Volume Profile Scalping
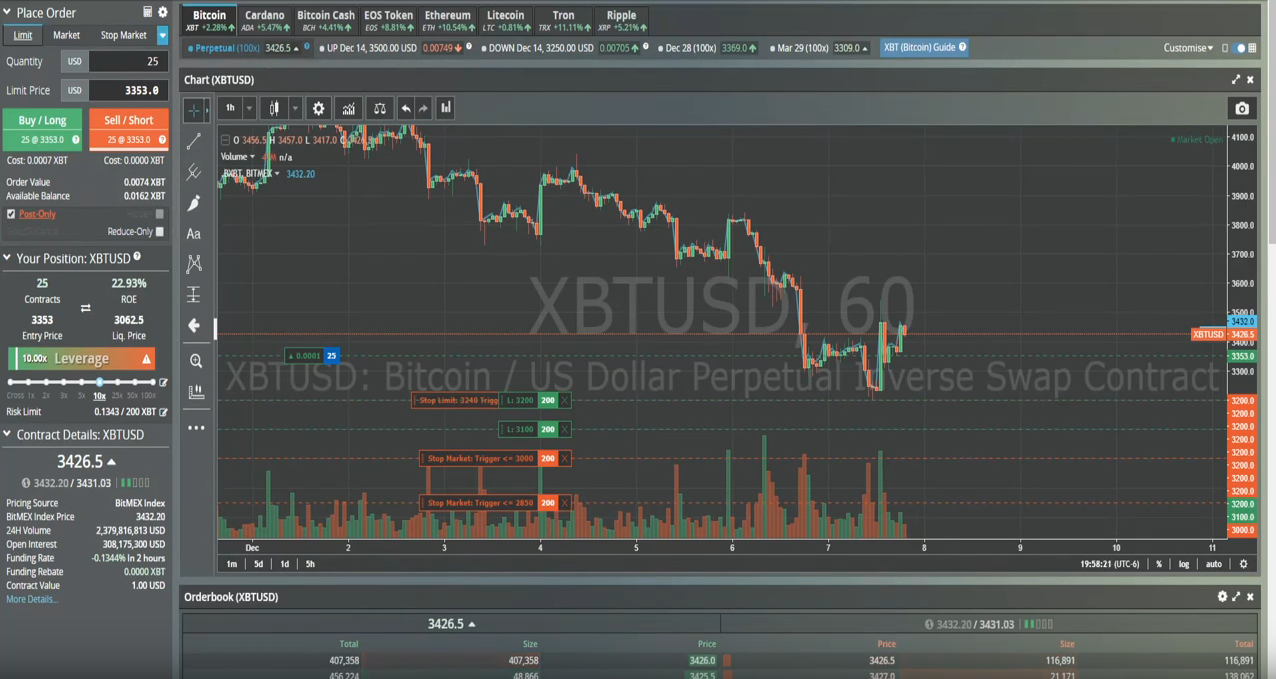
BitMEX 201

In this Webinar we will cover:
- Bitmex Introduction
- How to set orders, take profits, stop losses properly
- How to trail stops
- Volume Profile Session Volume (VPSV) Indicator and Strategy Introduction
- Three types of trade setups - Aggressive Initiation, Return to Point of Control, and Violent Rejections.
Fisher Transform, Divergence, & Deviation (w/ EpistemiCrisis)
The Fisher Transform is a technical indicator, created by John Ehlers in the 70's that transforms price data into a Gaussian normal distribution. Traditional oscillators measure price data as a sine wave, the issue with that is that their extremes are located markedly at the tops and bottoms, equaling a lot of noise for a trader looking for an accurate indicator.
- Also, because of this handicap, traditional oscillators tend to "lag" behind price data. The Fisher transforms price data into a Gaussian normal distribution, more commonly known as a bell curve. With a bell curve, the majority of all data points will fall within 1 standard deviation of the median. This means that extremes at the tail ends of the distribution will be rarer, given us clearer signals for entry and exit into the market.
- Alex will be discussing a basic Fisher crossover strategy, using the Fisher to confirm and trade a trend, when to exit, and how to tune the Fisher across multiple time frames.
As well as:
- What is the Fisher
- How to use it
- Spotting and trading divergence
- Oversold and overbought
- Trend signaling
- Trend trading and counter-trend trading.
Introduction to Risk Management
In today's video we will take a deeper dive into Risk Management with an emphasis on BitMEX Position Sizing and the effect of Leverage.
We will be going over:
-How to calculate your position size based of your stop loss.
-How leverage affects your position sizing.
-How your stop loss affects your position sizing.
-How to make more profit by assuming more risk.
-Dispel incorrect notions about Leverage.
-Demonstrate how to use the Bitmex Liquidation Calculator.
-Demonstrate how to use the Position Sizing Calculator.
Risk Management 101, 102, & 201
TBA
Support & Resistance Strategy
Contents
- What are Horizontal Support & Resistance Levels?
- How and why are they formed?
- How do I plot them?
- How can I trade them
- Why should I?
Time Transformation Indicator Strategy
In this webinar I introduce my custom indicator: Time Transformation.
Learn how to identify overbought and oversold buy and sell alerts, capture the dominant trend, trade divergences, and learn the effect of volume on price action.
VIP Ask Me Anything

Here just a few examples:
- Live Walkthrough of Trading on 3 Commas Utilizing PTP Strategy - How to set entry, stop loss, take profits.
- Live Trading Work Flow - Going from Charts to Execution to Walking Away
- Live Demonstration of the Advanced Position Size Calculator and Trading Journal
- Live Demonstration of Quadrigo Position Size Indicator - How to Utilize
- What alerts to set after entering a trade - How to manage active trades
- And many more!

