
Market Update & Insights 04-02-19: Overall Outlook, Bitcoin Google Trends, BTC/USDT, & ETH/USD
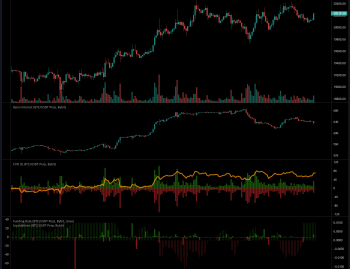
Just to give you an idea of these movements, Open Interest dropped on the pump from about 618$ million to 409$ million. Open Interest represents the amount of positions that are being put on, either long or short. When it's number rises it means individuals are opening new positions, when it goes down it represents traders getting stopped out or taking profits. A massive drop like that typically implies consolidation, as it will take time for enough positions to be entered into to make highly volatile movements likely. Remember, you only break out of a range one time. The rest of the time, you long support and short resistance.
Over 500$ million USD worth of liquidations occurred on BitMEX last night.
Just a side note, be cautious of taking trading advice from anyone who says they made bank on this last run (IE: Got Lucky) but says things like "Bitcoin looks unstoppable! Crazy!!! Over 5k!!" Those are the kinds of individuals were they not lucky enough to have been in a position, would have likely bought the top out of FOMO. Highly emotional moments are the MOST IMPORTANT times to remain stoic and composed, as those are the moments when we make the most pivotal decisions that we either look back upon with relief at our composure under fire, or berate ourselves for emotionally reacting the completely wrong way.
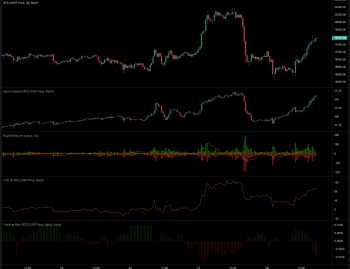
24H Bitcoin Volatility
made a massive spike, breaking out of it's consolation range that has been dominant for the last several months.
TradingView Chart

What's Bitcoin Trending Like On Google?
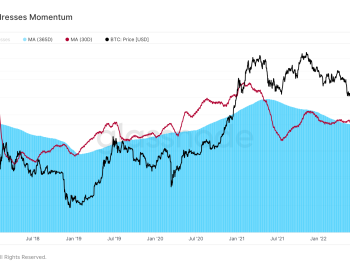
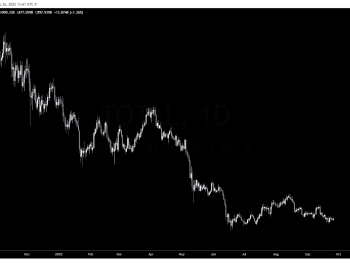
Here's something we don't often look at, but I've seen lots of individuals pointing out that Google Trends is bullish for some reason. Here are the search results for the last two years for Bitcoin on google trends. There is absolutely nothing bullish about this chart. Something going flat at the bottom of a downtrend CAN indicate accumulation, for example if we apply our technical analysis skills to this line chart, but always remember, a data metric needs to prove it's bullishness by actually showing some growth upwards. We saw lots of sideways movements from many coins during the bear market, and they consolidated, broke bear, and continued further down. So I don't see anything bullish about this chart. This will be something to keep our eyes on.
Last Two Years: Google Trends: Bitcoin

Over the last two years, the lowest value was a 4, currently level is a 7 so we are approaching two year lows for Bitcoin interest on the internet.
Last Year: Google Trends: Bitcoin
Over the last year, lowest levels recorded are where we are currently at, 44. The Google Trends is a relative scale from 0 to 100, so we are slightly below the mean.
Just for fun, here's the Google Search results for the last 24 hours. Look at what time they explode. :')
Now one interesting chart that I've come across and seen is comparing this movement to the bulltrap that occurred right before price dropped from 6k to 3k levels. As we'll draw on this chart, Bitcoin was trading into a descending triangle and then put in a bull trap. I was shooting videos back during that time and if you recall we talked about this Bull Trap at that time, as there was no fundamental reason to believe that Bitcoin would bottom at 6k after weakening that support level so many times. Now we see a different scenario now, with price trading into an ascending triangle. So you guys know how I feel about chart patterns, Fibonacci, things of that nature that are subjective and not objective data sources. But I'd be interested to hear your comments on this. Do you feel this is a bull trap before lower prices, or the beginning of a genuine uptrend?
Technicals:
Price hit the 1.618 Fibonacci Extension if we take a measurement from swing low to swing high. Now I'm not a huge fan of Fibonacci, not because it can't generate critical horizontal levels, but because most individuals that go to use it don't develop a clear system or strategy. There are so many lines generated from Fibonacci, that developing an if this then that strategy is often difficult, and it becomes a "hind sight" indicator. Price will often completely disrespect many, many Fib levels, but as soon as one is respected, guarantee that Crypto Twitter will light up with it, making sure you know that the once in a blue moon when a Fib retracement level is perfectly respected. Often it's not the one you were watching, and that's why Fibonacci largely in my eyes is a "hindsight" indicator. It's great when it works, but is not the best basis for a trading strategy.
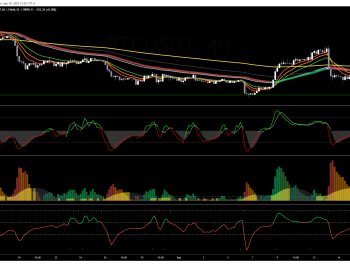
BTC/USDT
Price was firmly rejected by the upper boundary of the Kumo Cloud. This completes the edge-to-edge trade potential I had mentioned several times in the past.
TradingView Chart
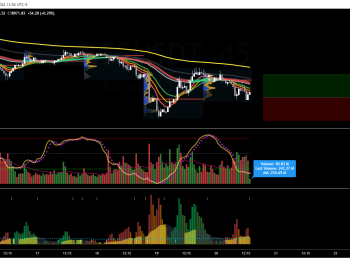
Now price finds itself stuck between the two higher weekly resistance levels that we has spoken about that were formed back in 2017. 4939 and 4509, remember that these are weekly levels. Now in keeping with my reasoning for why these levels were important in the first place: When an area that is supposed to act as demand is disrespected, it often acts as supply on a re-test. We can see that Bitcoin's price did not largely respect these areas, respecting instead more broadly the Kumo Cloud. However, these levels are not to be disregarded. I'm interested in that price level, of 4509 with potentially a wick down to test 4450 which was a liquidity zone for the establishment of the bearish orderblock that supressed price since it was formed in November.

Keep in mind that traditionally, when price is inside the Cloud, it represents a no-trade zone. The edge to edge trade is a riskier trade that has a lower probability of success, but is a popular method especially when your bias is that we are breaking out of accumulation.
I would expect to see price consolidation between these two weekly levels.

I'll be longing the initial retest of the 4450-4500 zone should TT give me the go ahead on my tradable Time Frame, and looking to short tests of the 4900-5000 region given the same entry trigger.
Looking at CCEMA, price is struggling to stay above our 200's, both SMA and EMA which are confluent on USDT pairings. Again, I expect price to squeeze beneath both Moving Averages and consolidate in that range. These will represent initial profit taking targets which will give confluence very nicely with our 8HR Average True Range values on longs from 4450-4500.
I will paint the bullish scenario, should we close a daily above the Cloud our upside profit targets would be 5545-5750 to reduce risk before the short from the 5900-6136 region.
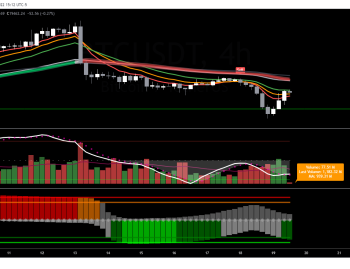
Moving over to the BitMEX Chart, we saw higher price appreciation on exchanges other than Binance and the USDT pairing for the most part. BitMEX hit a high of 5144.5. Love this market. We've currently sold off about 8% of that movement so far and are looking at a re-test of that same weekly resistance level at 4624. Similar to BTC/USDT, XBT actually wicked strongly outside of the cloud briefly before trapping buyers and now looking to close firmly back within the cloud.
Similar to my thoughts on BTC/USDT, I really want to see more consolidation before I make a strong move. Painting the bullish scenario, a daily close above the Kumo Cloud would give us upside targets of 5462-5743. Our ranges are wider on the BMex chart, however I always look to the USDT chart for true direction.
ETH/USD
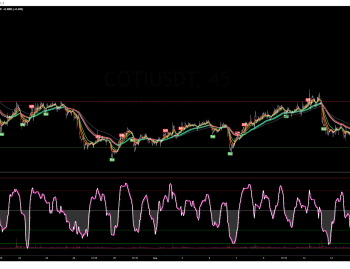
Ethereum did not put in the same insanity that Bitcoin did, although it's USD pair did have a very bullish reaction. Simple set up here, with the logic of an area of supply that was disrespected expecting to act as demand on the re-test. Pullbacks to 149-147 I'll be going long on, with a soft stop below that confirmed ascending trend line. Our horizontal level of resistance was respected perfectly, and painting the bullish scenario we can see upside targets of 170 and 181.
This pullback will be confluent with my Kumo Cloud break strategy. When price breaks the cloud, golden cross, TK Cross, whatever bullish Overlay Indicator signal you can get, I always wait for the pullback for confirmation of an S/R Flip before entering a trade in that direction.
Breaking that confirmed ascending trend line, would be a short down to these levels. However I need to see consolidation and clear signs of distribution now, to be eager for a longer-term swing short position on Ethereum.