
Market Update & Insights 03-25-19: XBT/USD, and ETH/USD
Justin W. Market Sentiments 7:22 PM
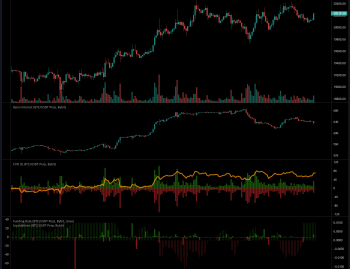
XBT/USD 8Hr
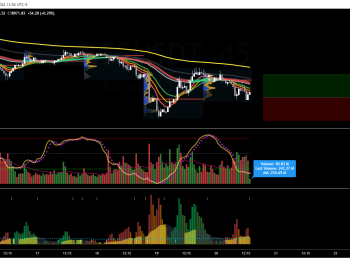
Good movements today to confirm our bearish setups. Even on the lower time frames it's very easy to see a consistent lower low, lower high pattern. Expect to see some consolidation after a volatile movement like that to the downside to establish previous support as resistance. My stop loss is set at break even.
Today's candle will close below the 8HR Kijun, the second to last level of support that we had discussed earlier. I would look for re-tests of 3925-3950 to re-add to short positions, should we make it up that high. It would not be unnatural though to re-trace to that zone to back-test support as resistance. However, that's been the pattern of Bitcoin lately. One movement a week. :')

We just saw a ton of long liquidations on BitMEX. Thus the 'Automatic Rally'. However, I don't view that as a sustained beginning of a new uptrend, but just an inevitability of a newly forming strong downtrend. Good for scalping, but we're focused on the bigger market movements here. If you compare the number of Liquidations to the amount of Turnover, you can spot the discrepancy. There was massive turnover on far less liquidations during the past week when price was trending up. Less turnover while price is trending down on top of massive liquidations, strong case for the bears. Be careful shorting the bottom of a volatile movement however, I do expect some short-term upside. Trade safely.
XBT/USD Metrics
Metrics
Time Transformation: Trending below zero, with a bearish Heikin Ashi trend. It will take another leg down to put us in oversold territory and not enough bullish momentum currently to give us a crossover. I don't trade crossovers below the zero line and above oversold territory.
Waddah Attar: Confirming all bearish trending indications. Bearish momentum trending above the explosion level.
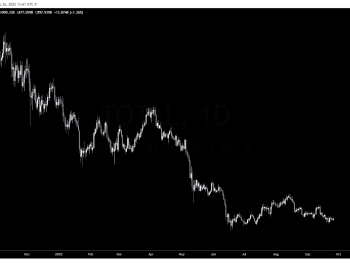
Longs to Shorts Ratio: 1.0883
Continued decline of the longs over the last few days. Traders on Finex remain indecisive about which way to take the market, with many hedged positions still.
MDR: Massive drop off in limit sells recently. Either indicative of sell walls being dropped off, or Order Book Manipulation. I vote the second.
https://vcdepth.io/coins/bitcoin-btc
BAS: Bullish, with a continued rise in Limit Buy Orders.
https://data.bitcoinity.org/markets/bidask_sum/30d/USD/bitmex?bp=5&bu=c&r=hour&t=m
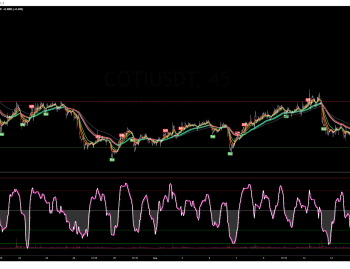
Ichimoku: Test of the Kumo Cloud on the most recent wick, Kijun zone holding as current support with Tenkan acting as resistance. Current Range: 3905-3963
TradingView Chart

CCEMA: Close below the 8HR 55 EMA, meaning we have lost the mid-term Bullish Momentum. Our wick found a bounce off the 200 EMA and 100 EMA. 8 under the 21 remains the most dominant crossunder, the next 8 under the 55 should produce another sell off within 2-3 days.
TradingView Chart

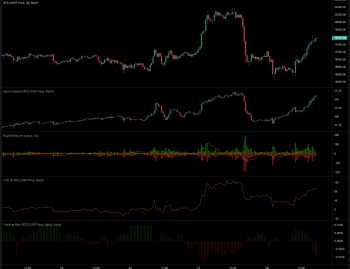
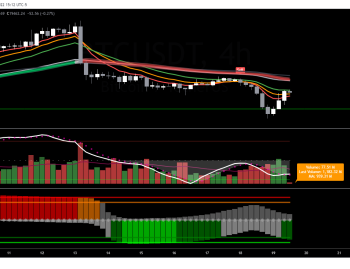
ETH/USD 8Hr
Ethereum looks much weaker than XBT at this point in time. What's interesting however is we are about to get a bullish cross on the 8HR TT. That's a signal I'll probably take in the short-term to hedge against the XBT/USD Short. Not changing anything about my position at the moment, but I am going to take 20% profit and move my stop loss to break even. Price should not re-visit those previous highs, but just in case.
To build the bearish bias, look at falling price and falling open interest in Tensor Charts.


ETH/USD Metrics
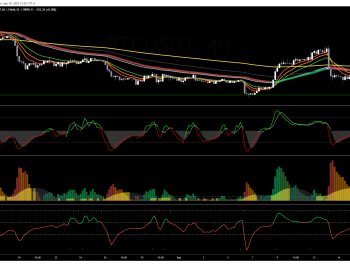
Time Transformation: Oversold, and flirting with a bullish cross.
Waddah Atar: Bearish confirming, trending above explosion level. On declining momentum it is to be noted...
Longs to Shorts Ratio: 4.52 Continuing their descent back to reality...
Ichimoku: Closing below the Kumo Cloud, indicating a bearish trending trade just got activated per the Kumo Cloud Break stategy. Stop loss would be a close above 135.45. That level where both the Kijun and Tenkan are hanging out are current overhead resistance.
CCEMA: 8 under the 55 Crossunder. Very bearish in addition to closing below the 100 EMA. The only little baby support we have left is the 200 EMA. We'll see if the 100 acts as resistance on a second test.
TradingView Chart