
Market Update & Insights 03-04-19: BTC/USDT Daily, ETH/USDT Daily, XRP/USDT Daily, LTC/USDT Daily
Justin W. 2:48 PM
BTC/USDT Daily Analysis (TradingView Idea)
What's happened over the last 24 hours?
We've seen a moderate market sell off across the board. Ethereum breaking critical support I believe was the trigger for this sell off, causing about 3 Billion to be wiped from our total market capitalization. We're seeing everything test it's critical support right now, from BTC to TRX. The next few days will be indicative of whether we will see a bullish continuation, or revert back into the bear cycle. As I've stated many times, I do not believe 3400 will support Bitcoin's price so a failure of these current levels will lead to a re-test of the previous yearly lows of 3200-3100 and potentially lower.
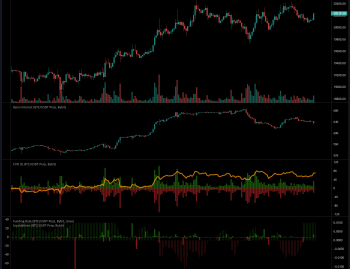
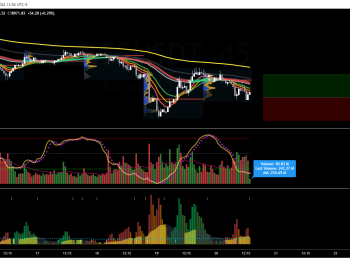
BTC/USDT Now
-Critical support at 3650 held, as you will recall my final down-side target of our oringal XBT/USD short.
-There is a liquidity pool directly below that level at 3570. Limit buy orders in that range would not be foolish should we consolidate sideways for the next few days in this range between 3650-3800. That would be a likely liquidity grab zone.
-The level of 3840 still represents our critical resistance, we need to close above that level for a bullish continuation.
-The levels of 3900-3970-4023 still stand as upside targets should price begin trading above 3840. Until we have a convincing daily close above 3970, that bullish scenario only represents a liquidity grab. Daily closes above those initiation levels/take profit levels is still necessary for a true bullish continuation to 4600.
My Positions:
-15% of my XBT/USD short is still open on my main account.
-Closed XBT/USD Long on hedge account at a loss.
-Closed XBT/M19 Long at break even in profit after first take profit level hit.

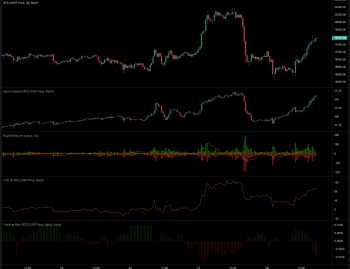
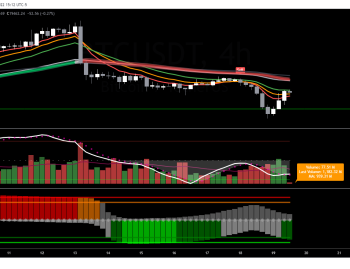
ETH/USDT Daily Analysis (TradingView Idea)
Ethereum is testing the lower boundary of the Ichimoku Cloud and strong support. Previous resistance turns into future support, and this is the level we currently fidn ourselves testing. Not to be confused with hopium, let us just be very clear the the upside potential for continued bullish momentum outweights the risk of breakdown at this level.
In simpler terms, we have a clear invalidation level below this current level of support. A daily close below that level would, as with Bitcoin, portent a re-test of previous yearly lows at 82. Similarly with BTC, I do not believe that the 100 level of support will hold again, thus why I have removed that line from my chart entirely. It's a non-entity now.
Our current levels of resistance are now the overhead Kijun-san, horizontal resistance (correspondent to the Tenken-san) at 140, and our liquidity zone/initiation level at 148. A reclamation of our first level of resistance is necessary at this time for a bullish continuation trade. In the meantime, with a good R/R profile, I will attempt the counter-trend trade and buy the re-test of support on ETH.

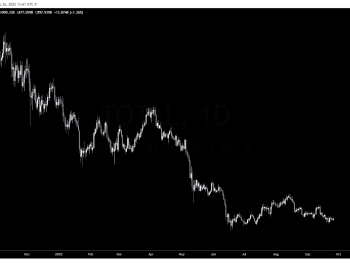
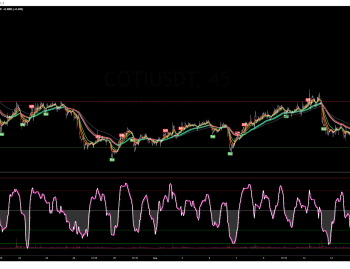
XRP/USDT Daily Analysis (TradingView Idea)
-Resting on 0.30$ long-term support level.
-This level is also the Point of Control.
-I believe XRP will hold this level if BTC holds 3650 as support.
-Should BTC violate it's support level, then that will trigger another violent market sell off.
-Two Initiation Levels for the XRP asset currently.
-Price closing above 0.33$ would be quite bullish, and would give us a high upside target close to 0.40$.
-The justification for this is the weakening of resistance at 0.37$ as seen by consolidation at that level previously.
-Should BTC violate 3650 on a closing basis, XRP is best kept open as a positional short.
-As things stand, XRP looks attractive as a buy at long-term support.
-This must be tempered by the weakening of that support after multiple tests.
-This remains a risky asset, even in the realm of Cryptocurrency.
-Trade safely.

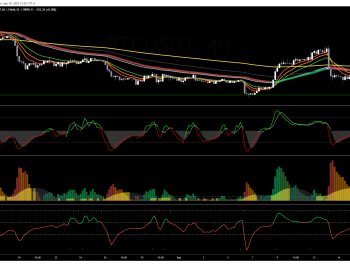
LTC/USDT Analysis (TradingView Idea)
-Showing more signs of strength than other coins.
-Pulled back to test the upper boundary of the local High Volume Node (HVN)
-That level was also my initiation level. Close below = Bearish.
-Should BTC breakdown, our next level of support is $40.
-Should Litecoin reclaim $47, I would expect a re-test of resistance at $54.