
Market Update & Insights 02-20-19: ADA/USDT, TRX/USDT, LTC/USDT, ADA/USDT, & BTT/USDT
Justin W. 11:38 AM
ADA/USDT Weekly
Similar to many altcoins, we are on the verge of a potential alt-season. We are also on the verge of a potential massive rejection from resistance. Patience is needed. If ADA can close above resistance then we could see a pretty smooth move to 7 cents.


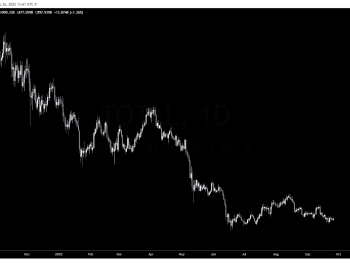
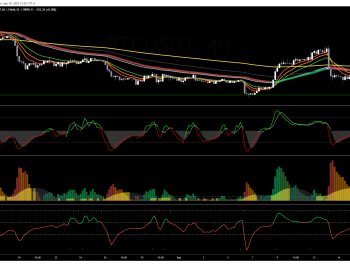
TRX/USDT Weekly
Does not look fantastic. Rally to the proximity of resistance, then a weekly close below the ascending trend line. We've formed a daily breaker (yellow dashed line) but we're struggling to get back above it. This is potentially classic S/R flip rejection.


Justin W. 09:03 PM
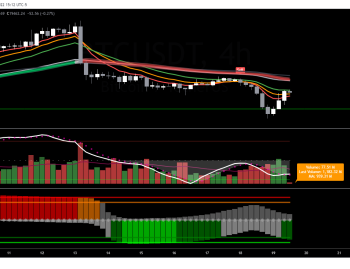
LTC/USDT 8HR TradingView Idea
-Price is too close to resistance for me to be an interested buyer.
-A break of 54.79 with a convincing re-claim would make me a buyer.
-Very likely upside targets from that price level.
-The Risk to Reward is not worth a trade to the upside on this time frame.
-Likely supports at 49 and 47.21.
https://www.tradingview.com/chart/LTCUSDT/SAaS40HQ-LTC-USDT-8HR-Analysis/
TRX/USDT Weekly
Does not look fantastic. Rally to the proximity of resistance, then a weekly close below the ascending trend line. We've formed a daily breaker (yellow dashed line) but we're struggling to get back above it. This is potentially classic S/R flip rejection.

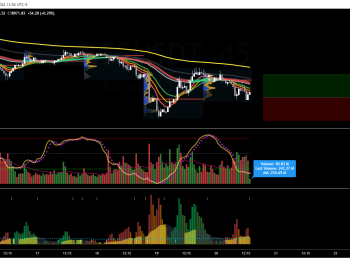
ADA/USDT
Watch price as it approaches this intra-day support. Should bounce back to the descending trend line.
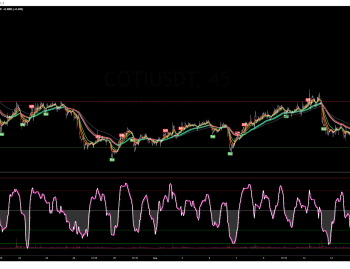
BTT/USDT 3HR TradingView idea
-Symmetrical pattern forming across all time frames.
-Approaching the lower bounds of that pattern.
-Potential Entries would be recovery from oversold conditions near support, or the breakout to the upside of the pattern.
-Cyan lines within the triangle itself are shorter-term profit targets for the oversold recovery trade.
-Cyan lines above the triangle represent longer-term profit targets for either entry
https://www.tradingview.com/chart/BTTUSDT/j2QWoDvi-BTT-USDT-3HR-Analysis/