


Features added in V4 Release:
- Updated Position Size Calculator
- Line Drawing for Target and Stop Loss display
- Target Price, Position Size to remove at Target, Distance to Stop Loss and Potential
- Loss data displayed on chart anchored to Target Lines/Stop Loss
- New anchoring for Position Size Calculator based on Long/Short input
- Transparent plotchars removed, chart squishing issues mitigated
- Ability to view historical Targets and Stop Loss
- ByBit exchange added for Position Size calculations
- Complete code review and refactoring
- New formulas for Median True Range and Custom True Range
Introduction
All traders have multiple factors to consider when constructing a profitable trading strategy. While many indicators focus on when to enter and exit in the market, all experienced traders understand that money management skills are most responsible for a profitable end result. To that end, knowing when to take profit and where to manage risk via a stop loss are essential to understand when constructing a trade. Harnessing the power of the Average True Range, we are able to dynamically alter our Stop and Target Zones to maximize profitability and reduce risk. To this end, we have created Quadrigo Average True Range.
Options
Let’s go through the input options one by one, so that you are able to comfortably navigate all that this indicator has to offer. The link below will display a picture of the layout of the settings for your convenience.
Quadrigo Average True Range Inputs Screenshot
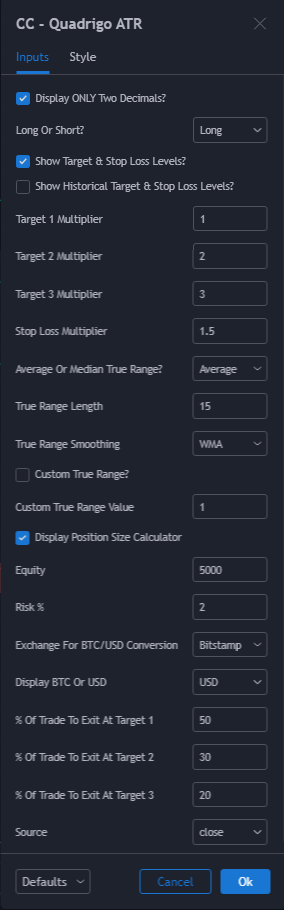
Display ONLY Two Decimals: This is a true/false option. It is true by default (box in input settings is checked). If true, all numerical values will be displayed with two decimals instead of eight. This is very helpful for trading most pairs that utilize fiat currency such as USD as the Quote Pair. You will want to turn this option off when trading pairs where the Quote Pair is a cryptocurrency such as BTC or ETH.
Long or Short: This is a drop-down option where the two options are Long or Short. Fairly straight-forward, this will adjust the Target and Stop Loss values to point in the correct direction depending on whether you are entering into a Long/Buy or Short/Sell trade.
Show Target and Stop Loss Levels: This is a true/false option. It is true by default. If true, Targets and Stop Loss will be plotted onto the screen dynamically as lines harnessing the power of Pine V4. Turning this option off will remove the lines from the chart without affecting the Position Size Calculator.
Show Historical Target and Stop Loss Values: This is a true/false option. It is false by default (box is not checked). If enabled, it will show Targets and Stop Loss as in older versions of Quadrigo, plotted as constant lines on the chart stretching all the way back to the beginning of the chart. This was decided to be too clunky to be displayed by default, as it takes up too much screen real-estate. However, especially for back-testing purposes, if one wishes to see what the Targets and Stop Loss would have been on a historical bar close with this option enabled they will be able to view that data.
Target 1 Multiplier: This is an input box, it requires a float value. That is, it can accept either a whole number integer or a number with a decimal. This number will determine your Target 1 Value. It will take whatever number is entered into this box and multiply the Average True Range against it to determine your Target 1 Value.
Target 2 Multiplier: See above - this will modify your Target 2 Value.
Target 3 Multiplier: See above - this will modify your Target 3 Value.
Stop Loss Multiplier: See above - this will modify your Stop Loss Value.
Average or Median True Range: This is a drop-down option, the two options are Average True Range or Median True Range. If Average True Range is selected, then this indicator will use the Average True Range calculation, that is, the average of a historical set of True Range values to determine the Average True Range value for Target and Stop Loss calculation. If Median True Range is selected, it will not take an average and will instead take the Median value of your historical look back period.
True Range Length: This is an input that requires an integer. This will represent your historical lookback period for Average/Median True Range calculation.
True Range Smoothing: This is a drop-down with the following options: Exponential Moving Average (EMA), Simple Moving Average (SMA), Weighted Moving Average (WMA), Relative Moving Average (RMA). This will determine the smoothing type for calculating the Average True Range if it is selected. Note: if Median True Range is selected above, this option will not have any effect as there is no smoothing for a Median value.
Custom True Range: This is a true/false option that is false by default. If enabled, it will override the Average/Median True Range calculation in favor of a users custom True Range value to be input below.
Custom True Range Value: This is an input box that requires a float value. If Custom True Range is enabled this is where a user will input their desired custom True Range value for Target and Stop Loss calculation.
Display Position Size Calculator: This is a true/false option that is true by default. If false, the Position Size Calculator label will not be displayed on the chart.
Equity: This is an input that requires an integer. This is where a user will enter their trading account balance for the Position Size Calculator, which will determine a recommended position size based off of their risk.
Risk %: This is an input that requires a float. This is where a user will enter how much risk per trade they wish to take on for the purposes of position size calculations. Whatever number is entered, the position size that will be recommended is one in which should their stop loss be hit, they will lose this percent of their total account balance.
For example: A user has entered 10,000 into the Equity box and inputs 2 into the Risk % box. If the recommended position size is taken on in a trade, should the stop loss hit then the user will have lost 2% of their 10,000 equity. That is a loss of 200.
Exchange for BTC/USD Conversion: This is a drop-down with the following options: BitFinex, ByBit, Coinbase, BitMEX, Kraken, Bitstamp, Binance. The Position Size Calculator can calculate position size in either USD or BTC values. This determines the exchange rate that will be utilized for that conversion calculation.
Display BTC or USD: This is a drop-down with the following options: BTC and USD. This allows the user to toggle between displaying position size calculations quoted in either USD or BTC.
% of Trade to Exit at Target 1: This is an input that requires a float. This is how much of the trade a user wishes to take off at the first Target. This will affect the quantity to set at that target on the chart during trade construction.
% of Trade to Exit at Target 2: See above.
% of Trade to Exit at Target 3: See above.
Source: This will affect what number the entire indicator is pulling from. By default it is pulling closing bar values. However this can be set to Open, High, Low, or any other indicator on the chart. Test this with different indicators for truly unique strategies!
Appendix
Strategies
Please refer to the Cracking Cryptocurrency Trading Academy for optimized strategies and information about the Base Line and the Pathways to Profit strategy building method. To begin your journey to consistently profitable trading, sign up today! Take advantage of our Premium Indicator Suite, Personal Mentoring, Pathways to Profit Strategy Building Course, Premium Webinar Series, Mastermind Community, and much more.
Credits
Furryboffin (Cracking Cryptocurrency)
Satoshi Nakamoto (hopefully Heaven)