


Features added in V2.1 Release:
- Added Multi-Time Frame Feature. View the Base Line of any time frame on any time frame for Three Screens Strategies.
- Added 'Heikin-Ashi Close' source option.
- Fixed ATR Multiplier option to modify your No Trade Zone Multiplier Settings.
- Added Trade Qualifier Line from Quadrigo ATR.
- Locked most calculations to close value, that way they're consistent across different time frames. Only the displayed Base Line is affected by modifying the Base Line Source option.
- Added ZLEMA smoothing option.
- Locked Donchian V2, Modular Filter, EDSMA settings to hard-coded values to clean up Input Window.
- Changed 'No Trade Condition - Qualifier' conditions. Please read below.
- General code refactor.
Introduction
The Base Line Indicator is designed to be a trader’s best friend in the market. It has been programmed to be as modular as possible. It allows a trader to know in which direction to trade, with it’s built in Automatic Trend Detection function and when not to trade with built-in No Trade Zone rules. Proper use and discipline utilizing the Base Line Indicator by itself or in conjunction with other indicators to form a comprehensive trading strategy will provide the user with the most successful trading experience.
Options
Let’s go through the input options one by one, so that you are able to comfortably navigate all that this indicator has to offer. The link below will display a picture of the layout of the settings for your convenience.
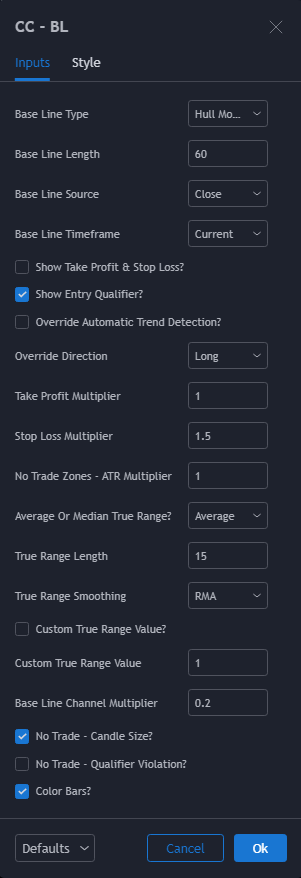
Base Line Type: Adjust the primary smoothing function for your Base Line.
Available Smoothing Functions
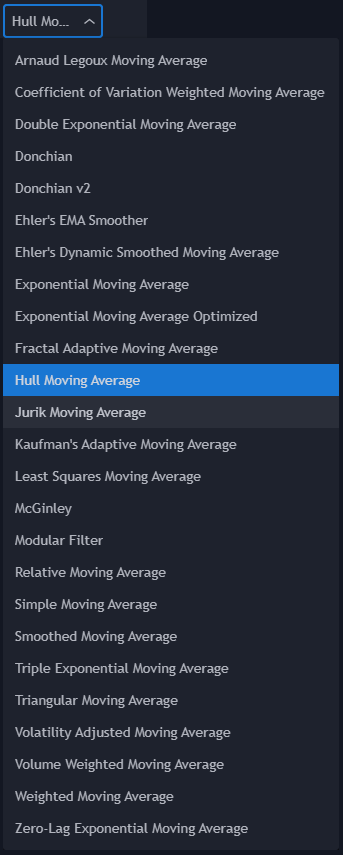
- Arnaud Legoux Moving Average (ALMA)
- Coefficient of Variation Weighted Moving Average (COVWMA)
- Double Exponential Moving Average (DEMA)
- Donchian & Donchian v2
- Ehlers EMA Smoother
- Ehlers Deviation-Scaled Moving Average (EDSMA)
- Exponential Moving Average (EMA) & Exponential Moving Average Optimized (EMAX)
- Fractal Adaptive Moving Average (FRAMA)
- Hull Moving Average (HULL)
- Jurik Moving Average (JMA)
- Kaufman's Adaptive Moving Average (KAMA)
- Least Squares Moving Average (LSMA)
- McGinley
- Modular Filter (MF)
- Relative Moving Average (RMA)
- Simple Moving Average (SMA)
- Smoothed Moving Average (SMMA)
- Triple Exponential Moving Average (TEMA)
- Triangular Moving Average (TMA)
- Volatility Adjusted Moving Average (VAMA)
- Volume Weighted Moving Average (VWMA)
- Weighted Moving Average (WMA)
- Zero Lag Exponential Moving Average (ZLEMA)
Base Line Length: Adjust the lookback length of your Base Line. That is, how many closed historical bars do you want the Base Line algorithm averaging to compute your Base Line.
Base Line Source: Select the source of the data you want the Base Line to smooth. Selecting close will average the closing value of each historical bar, open the open value, high the high value, and so on. Recently added is the 'Heikin-Ashi Close' option.
Base Line Timeframe: Select the timeframe you would like your Base Line to represent. For example, if you are on the four-hour chart and would like to trade using the data of the daily Base Line, simply go to the four-hour and select '1 day'. The other popular strategy is to use the weekly Base Line for the 1 day timeframe.
Show Take Profit & Stop Loss: When checked, this indicator will display bands around price indicating your initial take profit (where you will take 50% of your position off) and your stop loss level. These levels will dynamically adjust with each bar close and intra-day as the closing value (current price until the bar closes) on the current bar.
Show Entry Qualifier: When checked, , this indicator will display a line above or below the Base Line, depending on closing price (if price closes above the Base Line, the Qualifier will be above the Base Line, if below below). The distance from the Base Line can be adjusted by the ‘No Trade Zones - ATR Multiplier’ option. The qualifier is a discrimiation tool to ascertain if price is too far away (moved too far away) from the Base Line to generate a profitable trading signal. The general rule is to only take trade signals that are between the Trade Qualfier and Base Line.
Override Automatic Trend Direction: The Base Line automatically determines that the trend is bullish if price is above it, and bearish if price is below it, and will automatically adjust your take profit and stop loss values based on whether you should be entering into long trades or short trades. That is, if price is above the Base Line, by default your take profit will be the green line above price, and your stop loss will be the red line below price, whereas if you are below the Base Line, your take profit will be the green line below price and your stop loss will be the red line above price. If you wish to trade counter to the Base Line’s Automatic Trend Detection, check this box to make the Override function true, and you can select the direction you wish to trade in from the drop-down.
Override Direction: Select the direction you wish to trade from this drop down. Selecting an option here will only affect the indicator if you have marked "Override Automatic Trend Direction" as true.
TP Multiplier: Adjust the value of your Initial Take Profit. This will be the number against which the Average True Range is multiplied, so by default your Initial Take Profit will be the value of ATR x 1.
SL Multiplier: Adjust the value of your Stop Loss. This will be the number against which the Average True Range is multiplied, so by default your Stop Loss will be the value of ATR x 1.5.
No Trade Zones - ATR Multiplier: Adjust your qualifying line for directional trades.
Average or Median True Range?: Select whether you want the algorithm to use an Averaging of the True Range or the Median of the True Range for Take Profit and Stop Loss calculations.
True Range Length: Adjust the lookback length of your Average or Median True Range function. That is, adjust how many historical bars of data you want to average/median to calculating Take Profit and Stop Loss.
True Range Smoothing: Adjust the smoothing function for your Average True Range.
Available Smoothing Options: Relative Moving Average(RMA), Simple Moving Average (SMA), Exponential Moving Average(EMA), Weighted Moving Average(WMA).
Available Smoothing Options: Relative Moving Average(RMA), Simple Moving Average (SMA), Exponential Moving Average(EMA), Weighted Moving Average(WMA).
Custom True Range Value: Select whether you want to use the Base Line’s automatic calculation of your Average or Median True Range, or just input your own True Range value to determine Take Profit & Stop Loss. Click this box to enable.
Custom True Range Value: Input your desired Custom True Range Value. This box will only work if you have enabled Custom True Range.
Base Line Channel Multiplier: Adjust the ATR multiplier you wish to use to calculate your Base Line Channel, that is, the upper and lower boundary lines of the channel that hugs your Base Line. This channel is used for determining No Trade Zones (or as an alternative strategy - Reversal Base Line Bounce Entry Zone).
No Trade - Candle Size: A No Trade Zone feature. Enable this option if you wish to receive No Trade warnings when price is within ATR range of the Base Line and a candle has a greater range value than your ATR. Recommended.
No Trade - Qualifier Violation:
Color Bars: If enabled, will re-color your candles based on Automatic Trend Direction and No Trade warnings.
Please note, all colors and plot styles can be customized from the Style tab of the input window.
No Trade Conditions
This indicator is programmed with three types of No Trade Zone conditions. These are areas of the market that we have determined are too risky to trade in. Ironically, these areas when looked at on the naked chart can often appear to be attractive entry areas. However, through statistical analysis we have concluded that there are certain criteria for dangerous conditions in which a loss is far more likely than a win. In the following section these three types of zones and conditions will be explained, as well as how to utilize them as part of your trading approach.
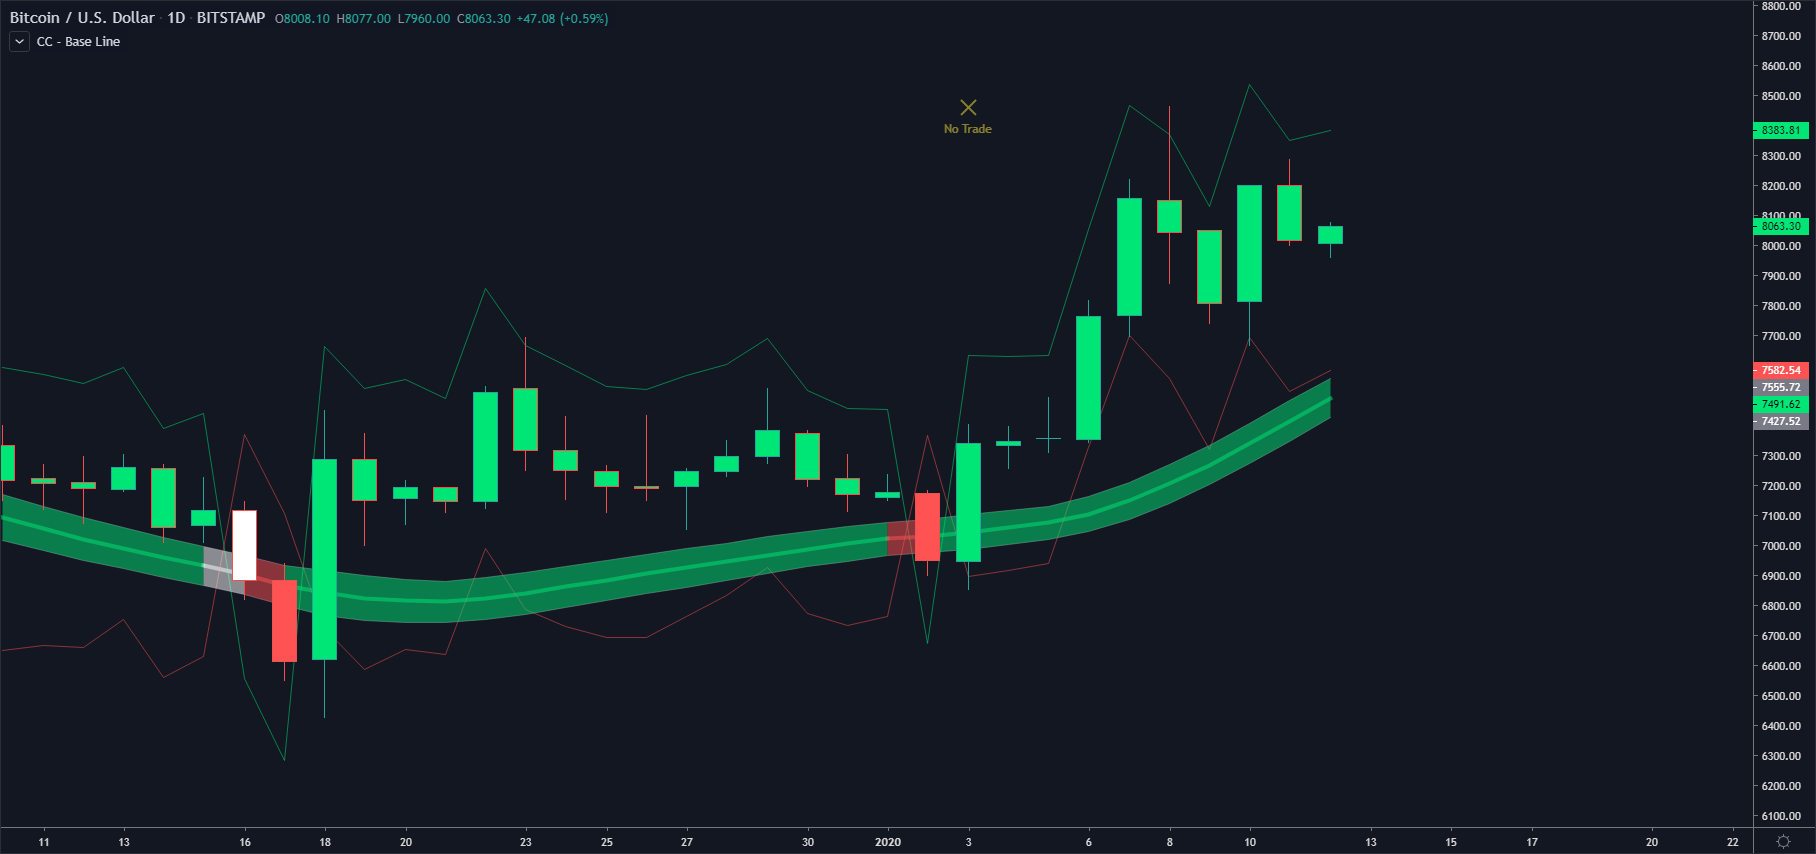
No Trade Condition #1: Candle Size Violation
The first condition one should approach with caution is Candle Size Violation. This occurs when the distance between the opening price of a candle and the closing price of a candle is greater than the value of the Average True Range. Experience has shown that more often than not, after such a volatile movement, directional swing trades per the Pathways to Profit strategy are unsuccessful. Waiting for a pullback is a good approach in these situations, and what we recommend.
If the option “No Trade Condition - Candle Size” is enabled in settings, then when such a condition occurs a yellow X will be plotted at the top of the screen with the words “No Trade”.
No Trade Condition #2: Qualifier Violation
The second condition one should approach with caution is Qualifier Violation. This occurs when an entry signal (in this case, closing on the opposite side of the Base Line) occurs on a candle that closes greater than the value of the Average True Range away from the Base Line. Similar to Candle Size Violation, experience has shown that entering after such a movement will more often than not result in a loss. Again, waiting for a pullback is a good approach in these situations as well.
If the option “No Trade Condition - Qualifier” is enabled in settings, then when such a condition occurs a yellow X will be plotted at the bottom of the screen with the words “No Trade”.
No Trade Condition #3: In Channel
The third No Trade Condition is based on the channel enveloping the Base Line. This channel can be viewed as an area of indecision in the market, as price is attempting to move from one directional trend to another. In times such as these, it is often a good strategy to avoid making a trade until price has cleared the channel and given a strong entry signal with rising volume.
When price closes within the Base Line Channel, there will be no additional plots at the top or bottom of the screen. Instead, if Bar Coloring is enabled in settings, the color of the candles/bars will be re-colored white instead to indicate this No Trade Condition. In addition, the color of the Base Line will recolor white as well to additionally reflect the No Trade Condition.
Note: For those practicing Reversal Base Line Bounces, this No Trade Condition might be very different. For those trades, instead In Channel conditions may represent the perfect re-entry opportunity. We recommend backtesting both methods to verify which method works best with your trading system. In addition, by increasing/decreasing the multiplier of the channel in settings, some very interesting continuation/exit signals can be generated.
No Trade Condition Recovery
As stated above, for Candle Size Violation and Qualifier Violations, we recommend waiting for a pullback. As such, the Base Line indicator can help alert you to when such a pullback has occurred, or when price has “recovered” to a better entry position. Therefore, this indicator will follow price for the next three subsequent candles after a No Trade Condition and alert you when this recovery has occurred. It will do so, for Candle Size Violations, by plotting a green flag at the top of the screen with the words “Trade” and for Qualifier Violations it will plot a green flag at the bottom of the screen with the words “Trade”.
Keep in mind, the green “Trade” flag does not mean that a successful trade is guaranteed, as in all things. It simply means that the No Trade Condition is no longer valid, and if your strategy is signaling an entry then the Base Line is confirming the validity of such a signal.
Note that for the In Channel No Trade Condition, as there are no plotshapes alerting you to not trade, there will not be plotshapes to alert you that price is no longer in channel. You will simply know when price is no longer closing within the channel by the Base Line changing color as well as the coloring of the candles/bars if “Color Bars” is enabled in settings.
Appendix
Strategies
Please refer to the Cracking Cryptocurrency Trading Academy for optimized strategies and information about the Base Line and the Pathways to Profit strategy building method. To begin your journey to consistently profitable trading, sign up today! Take advantage of our Premium Indicator Suite, Personal Mentoring, Pathways to Profit Strategy Building Course, Premium Webinar Series, Mastermind Community, and much more.
Moving Average Information
These links will take you to other sites not maintained by Cracking Cryptocurrency. While we have reviewed their content at the time of publishing, we are not responsible for any errors or omissions on these sites. Please let us know if you find any errors or dead links.
Donchian - Donchian channel
Exponential Moving Average (EMA) - Exponential Moving Average - EMA Definition
Simple Moving Average (SMA) - Simple Moving Average (SMA) Definition
Relative Moving Average (RMA) - RMA (Relative Moving Average)
Modular Filter (MF) - Modular Filter - Spot Trends And Smooth Price — Indicator by alexgrover
Jurik Moving Average (JMA) - Jurik Moving Average — Indicator by everget
Weighted Moving Average (WMA) - Weighted Moving Averages: The Basics
Double Exponential Moving Average (DEMA) - Double Exponential Moving Average (DEMA) Definition and Calculation
Triple Exponential Moving Average (TEMA) - Triple Exponential Moving Average – TEMA Definition and Calculation
Smoothed Moving Average (SMMA) - Smoothed Moving Average (SMMA)
Volume Weighted Moving Average (VWMA) - Volume Weighted Moving Average (VWMA) — Technical Indicators — Indicators and Signals
Hull Moving Average (HULL) - How to reduce lag in a moving average
Ehlers Deviation-Scaled Moving Average (EDSMA) - Ehlers Deviation-Scaled Moving Average (DSMA) — Indicator by everget
McGinley - McGinley Dynamic Indicator Definition
Coefficient of Variation Weighted Moving Average (COVWMA) - Coefficient of Variation [DW] — Indicator by DonovanWall
Fractal Adaptive Moving Average (FRAMA) - Fractal Adaptive Moving Average (FRAMA) — Technical Indicators — Indicators and Signals
Triangular Moving Average (TMA) - Triangular Moving Average (TMA) in Trading
Kaufman’s Adaptive Moving Average (KAMA) - Kaufman's Adaptive Moving Average (KAMA) [ChartSchool]
Arnaud Legoux Moving Average (ALMA) - Arnaud Legoux Moving Average (ALMA) — Indicators and Signals
Least Squares Moving Average (LSMA) - Moving least squares
Zero Lag Exponential Moving Average (ZLEMA) - Zero lag exponential moving average
Credits
Furryboffin (Cracking Cryptocurrency)
Mikhel00 (Trading View)
Jiehonglim (Trading View)
Chris Moody (Trading View)
everget (Trading View)
DonovanWall (Trading View)
Satoshi Nakamoto (hopefully Heaven)