
Bitcoin Strapping on Combat Boots! (Market Update 03/02)
Support the author on Steemit!
Hello all you crypto lovers out there! Hope you're feeling fine!
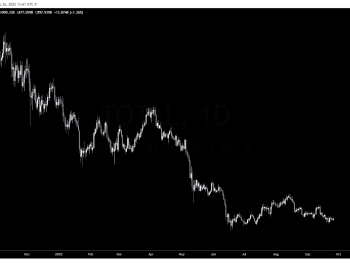
Couple different things today. With all the Bitcoin excitement in the air over a very nice bullish week, I thought it would be a good idea to take another big picture view of Bitcoin's price history.
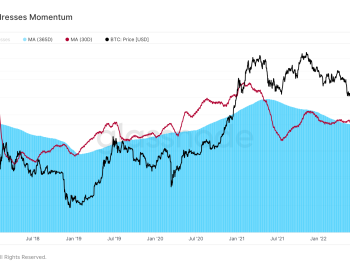
What I've done in the first chart is map a basic Schiff Pitchfork price channel. This is created by measuring from your first market bottom, to the next market top, and finally the next market bottom. This will visually generate a channel, an indicator that you can use for trading if you understand how to use it.
Taking the bigger picture view, we can see that Bitcoin merely traveled to the top of it's projected channel, a very natural occurrence. What would have been, not really an unusual event, but one that would have necessitated the drawing of a new channel, would have been the breakout of Bitcoin above and beyond the outer limits of it's trading channel.
So referring back to basic principles of channels: price likes to migrate back towards the median line. If it reverses at the median line, it tends to move back in the opposite direction. If it reverses BEFORE it touches the median line, then it tends to move in the opposite direction AWAY from the median line farther then from whence it came. In plain English, if we had reversed prematurely, we would have exploded upwards.
We clearly didn't do that, we came down exactly as planned and touched down on the median line, and are now reversing. A likely scenario is a slow continued growth, maintaining bullish momentum, until we reach the next line of the channel, around 20,000. This time however, when we reach 20,000 it will be after a proper retracement. It's even possible we could consolidate around 20,000, or break through it all together for another re-test of the upper level. At that time however, the upper level would be around 40,000.
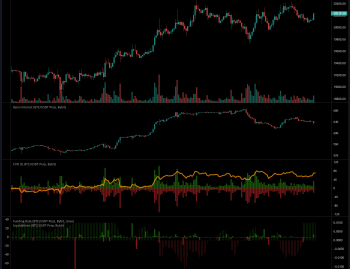
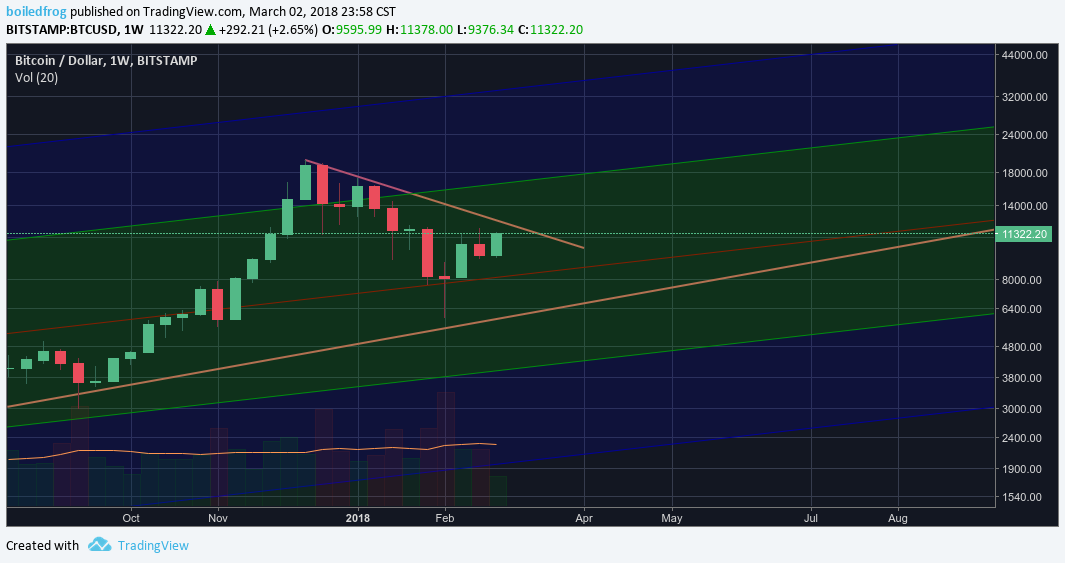
Moving to candlestick theory, you can see that we are set up to close this week above the close of last week's doji candle, which is a very positive thing. The position isn't set up for a perfect entry yet, because for that we would need a candle to trade ABOVE the high of last week's candle. That is that infamous 11,900 level that I've been talking about in my previous posts: the convergence of multiple resistance levels - Fibonacci line, downward moving trend line, ichimoku tenkan line.
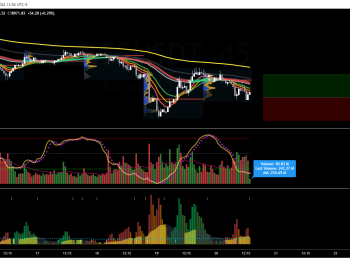
The daily chart is where all the action is however.
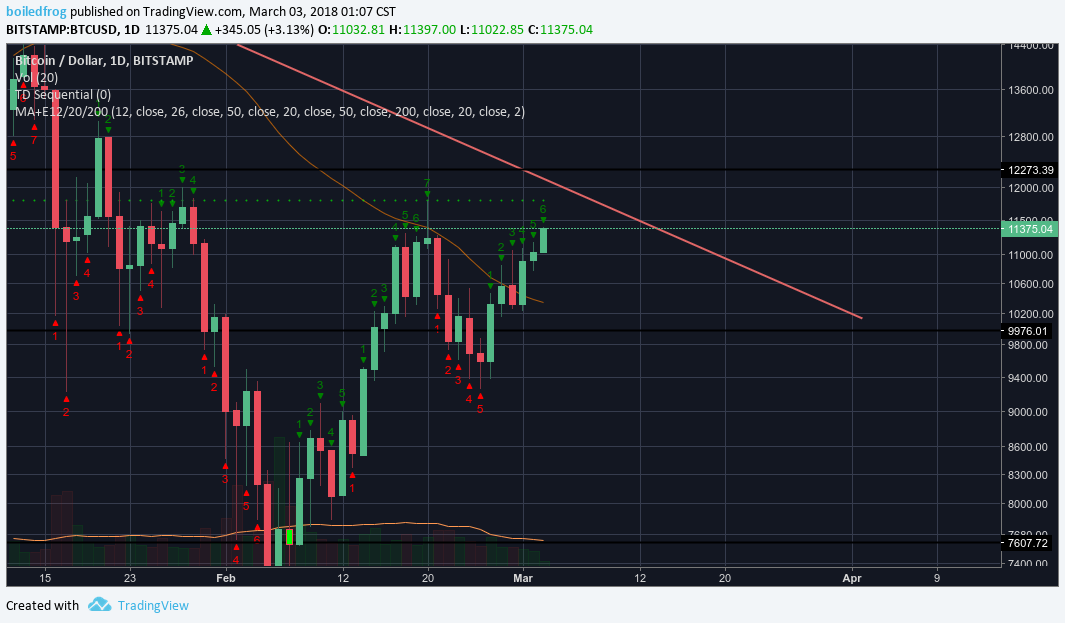
You can see that we've broken past two of the resistance levels that I had spoken about in my earlier posts. The first being the 50% Fibonacci level, and the second one being the 50 Day Moving Average. Both were just annihilated underneath Bitcoin's relenting upwards ascension. The next two levels of resistance on the traditional chart come from the set-up trend line using the TD-Countdown indicator, and the downwards trend line. Again, these two converge around that high of the last candle on the weekly, around 11,800. That is the key area to break, if we can't break that area in a timely fashion, then I predict we will get rejected by the downwards trend line and go all the way down to form a higher low than 6,000 before moving slowly back up to try again. However, if we break through 11,800 it's going to be straight to 13,000.
This is further bolstered by the fact that we're only a daily 6 of 9 on the Countdown indicator, calling for three more days of upside, which could be enough to break us past the resistance, but again here the weekly chart gets in the way. It would actually be ideal for us to delay breaking the resistance until next week so that this week's candle would close ABOVE the close of last week's candle but not the high, and then we would have a perfect bullish entry once next week's candle stated trading above the high of last week's. This would also give us a 2 of 9 trading above a 1 of 9 on the TD which is also a great entry signal.
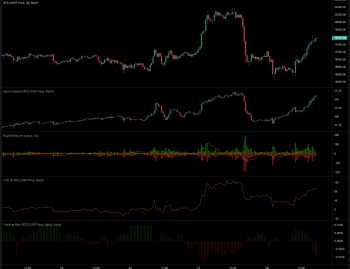
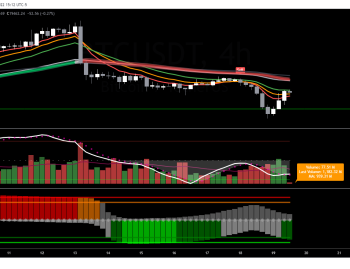
Moving back to my roots in FX, I've decided to dust off the old Ichimoku Cloud indicator. This has always been one of my favorites, and due to popular demand I'll start using it more often. Let's see if it confirms my analysis of the daily chart.
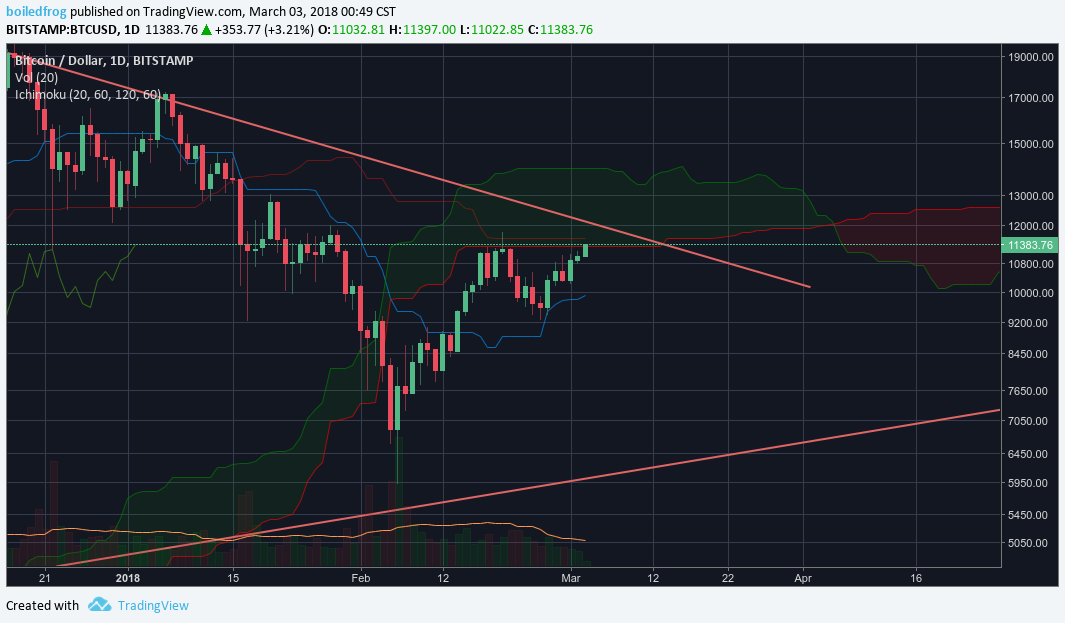
Well the Ichimoku would have given us the signal to exit the Bitcoin market at 13,594. That would have saved us a lot of wealth. Things got really ugly when the price AND the Tenkan-san line (basically a fast EMA) broke below the Cloud itself. Not a good sign. Now we're seeing an uptick in the Tenkan and the price moving up right now to test the bottom of the cloud. It's my strategy that once the price breaks through the bottom of a cloud, it's a safe breakout trade all the way to the edge. The only thing I'm nervous about is the Kujin line (the slow EMA) sitting RIGHT above the entrance of the cloud at 11,600. A rejection at that line would be a fakeout and would wreck a lot of breakout traders.
However, if I take what I'm seeing on this chart in conjunction with what I see without the Cloud, this is my takeaway:
We're moving into the cloud, and moving up towards a major zone of resistance. If we break past the Kujin, the initial line of resistance on our way to the main resistance at 11,800, then the momentum should be enough to carry us through all the way past and to the opposite edge of the cloud: 13,300-13,700. That movement will also give us a TK bull cross: where the Tenken line crosses above the Kujin line, which is your entry signal (given a checklist of other market conditions that you want to exist).
Off to the races we go!
Consider joining the Cracking Crypto Discord Channel, the trading group I provide content and signals for. We have a highly respected and experienced team of traders and investors, and an active community for crypto lovers and traders from all walks of life.
*I'm not a financial adviser. The information here is for education purposes. Trading and investing are wonderful things to do, and it's OK to take advice and to learn. I'm glad you're here right now reading this, educating yourself. Don't take my word as the gospel, and be careful. All investment's and trading opportunities carry risk, I'm sure you reading this have the potential in you to profit from a careful trading plan, and wise investment choices. Do it right, do your research, and don't trade stupid. Very best of luck to you!*