
Bitcoin Update 02/28
Support the author on Steemit!
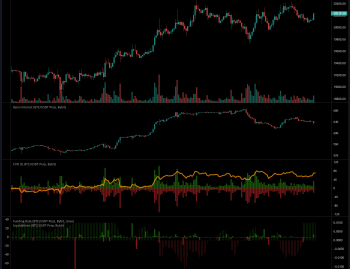
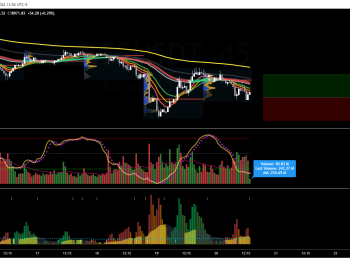
I started making this post earlier this morning, and it would have read like this:
"We are still looking to close above last week's doji candle. This is a very good sign, meaning we're maintaining the bullish momentum to stay above last week's low and even last week's close. If we were to trade above last week's high, that would be an amazing sign and the perfect opportunity to enter into your long trade."
Now, twelve hours later, we've had a bit of a dip. The market's been real crappy today, everything's down. Just a slow day. I don't foresee this being much of a downturn though, volume is low. This is just a little bit of consolidation and short-term profit taking.
Still optimistic to close above last week's candle. Although as I stated I would love to see a trade above last week's high.

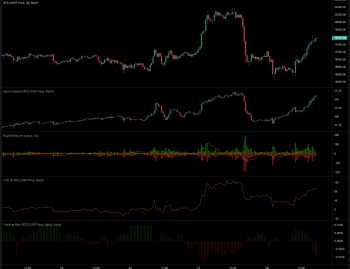
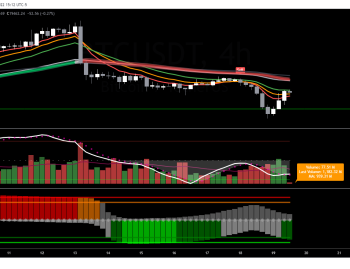
Moving to the daily chart we get a bit uglier. We have this massive cloud of resistance hanging above us that we need to break through before it's off to the races again. We have the 50 Day Moving Average, the descending high trend line, the fibonacci level. However, every resistance line we break through we can become more bullish, entering into a larger position for every resistance we break through. As of this moment this is still a cautious time for trading Bitcoin. On the plus side, if we don't break through this resistance line soon, yet we continue to consolidate in the margin of the resistance, that is a very good sign. The longer you stay below resistance and consolidate without capitulating, the stronger and more violent of a move upwards once that resistance is broken. You can equate it to being stir crazy, stuck inside your house for so long you're just bursting with energy to get up, get moving, and do something. We're also looking at this potential cup and handle forming, so we'll wait and see how that develops. It's low, but the only stop loss I could call for a swing trade is around $9,200. It's the swing low, and unless you want your trade to be so tight you will miss out on profit, it's the only one I could call. Otherwise if you want to play it that way, you would set it beneath the current candle. Hoping that you don't capitulate and consolidate on the daily. Once we move past one of the resistance zones, I would be moving my stop loss all the way up to 10,000. Another thing to consider in chart formations is the potential forming of a bullish pennant, but again we must wait and see.
Ugly resistance cluster ahead! Beep beep!
Consider joining the Cracking Crypto Discord Channel, the trading group I provide content and signals for. We have a highly respected and experienced team of traders and investors, and an active community for crypto lovers and traders from all walks of life.
*I'm not a financial adviser. The information here is for education purposes. Trading and investing are wonderful things to do, and it's OK to take advice and to learn. I'm glad you're here right now reading this, educating yourself. Don't take my word as the gospel, and be careful. All investment's and trading opportunities carry risk, I'm sure you reading this have the potential in you to profit from a careful trading plan, and wise investment choices. Do it right, do your research, and don't trade stupid. Very best of luck to you!*