
Bitcoin Conviction Remains High – But A Plunge Is Still Likely
A beautiful continued green day in the markets for us here in Crypto Land! LUNC, still pumping, is leading the charge, along with OKB, BCH, and ATOM, all four up double digits for today so congratulations to those holders. Every other crypto asset, for the most part, is up a modest amount today.
Bitcoin was able to push about halfway up the length of the descent we experienced the day before yesterday. Today's early morning price action saw Bitcoin trade down about half of that length, but we have now pushed back up to where we closed yesterday's daily candle.
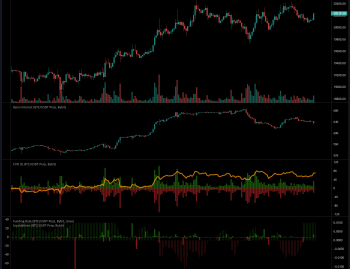
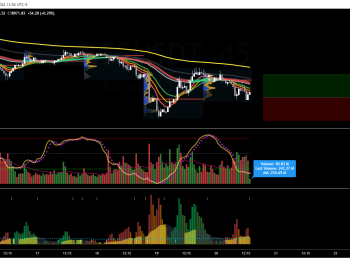
The Regular Bullish Divergence we noticed yesterday and took action on is/has played out, and the Relative Strength Index has now closed back above it's Moving Average on the daily time frame. Nominal (REAL) volume remains consistently high across exchanges.

Open Interest has been consistently dropping since the middle of yesterday, as price was pumping and even now as price has been declining. Cumulative Volume Delta however, has been consistently rising. This indicates that this drop in Open Interest is not caused by longs closing out their positions in profit, but rather shorts closing out their positions at break even or at a loss.
Funding is predominately positive across the major derivative exchanges, indicating that the sentiment has shifted to net long among traders. Furthermore, we just experienced a nice uptick in long liquidations on the recent price low of 19,200, an event that saw Bitcoin begin to stride back upwards in response.

I also want to bring to your attention a long-term indicator for Bitcoin's market cycles, the Bitcoin Rainbow Price Chart Indicator. This indicator overlays colored bands on a logarithmic chart to better explain the historical market cycles of Bitcoin. As you can see from the chart, we are in the lower blue territory, which is known as the 'FIRE SALE!' area.

While I am not adjusting my recommendation to allocate more than 25% of your total desired investment capital into Bitcoin at this time, it is important to understand what area of the market we are in. I will remain conservative until we have true on-chain metric recovery, at which point I will feel more confident about increasing our allocation towards risk-on assets.
The market capitalization of Bitcoin rose by about 2% overnight, and we see a 1% increase in Active Addresses. While these are good indicators, we are still a long ways from being out of the woods.
Very comforting are the on-chain metrics regarding Bitcoin investors with the highest conviction, long term holders. Two metrics we can use to view this are Liveliness and Hodler Net Position Change.

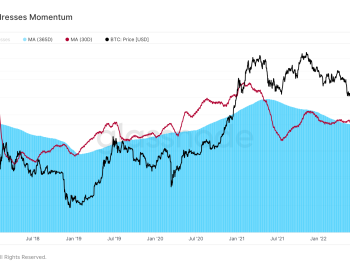
Here we can see the Liveliness chart of Bitcoin. This metric tracks the ratio between Coin Days Destroyed and Coin Days Created. Essentially, when Bitcoin is spent that has been sitting in a wallet for a long time, that is considered a destruction of Coin Days. The longer a Bitcoin sits in a wallet, that creates Coin Days.
Using this metric, we can determine the mood and behavior of long-term Bitcoin investors. If this metric is trending upwards, then holders are preferring to spend their coins, generally at a profit, resulting in the destruction of Coin Days. If however, investors are content to accumulate and sit tight, this metric trends downwards, indicating a dominant accumulation regime.
Currently, we can see that this metric has been in a marked downtrend since the market top in the summer of 2021, and we have just recently broke below the triple top formed in the 2018 bear market. This indicates that long term holders are content holding and accumulating their coins, showing a high amount of long-term conviction.

Next, we can look at Hodler Net Position Change. This takes the Liveliness metric into the supply domain, where we can view the monthly changed to the supply of Bitcoin that is being held for the long term. We can see that from November 2020 to June of 2021, Bitcoin investors were in a net distribution regime. Then, following the market bottom in June of 2021, investor sentiment shifts towards a net accumulation regime.
As you can see, this metric is actually reaching new all time highs, with investors currently increasing their hodled stack of Bitcoin at a never before seen rate of $70K+ BTC per month. Not only are Bitcoiners accumulating, their doing it at record rates even as current price action remains dire.

Finally, we look at one more long-term metric before turning towards profitable opportunities today. The Bitcoin: Percent Supply in Profit chart helps us understand based on buying activity the percentage of Bitcoin's circulating supply that is in profit or loss. We can see from the chart that during Bitcoin's pump to $24K, we rose from 50% of Bitcoin in profit to 64% of Bitcoin in profit. However, this metric has been crushed by the recent drop to $18K, falling to just 48% of supply in profit.
Not only does this mean that 14% of Bitcoin's supply tumbled from profitable to unprofitable, it also sends this metric into the lower green band territory which has foretold market bottoms in the past. While we do have to be careful, due to current price action being dominated by short-term holders, who are the most likely to sell, long-term things are looking very constructive for Bitcoin.

Although we have many signs that are pointing towards a local market bottom, with long term holders taking back seat to current market activity, that means that short-term price action is dominated by short term holders. We've established that the majority of these market participants are underwater, and we also know that the STH cohort is the most likely to sell when faced with financial pressure.
This makes the possibility of another capitulation event, driving prices much lower, a non trivial possibility that we need to prepare for. This is the primary reason I am recommending no more than a 25% allocation towards Bitcoin at these price levels, and why I am constantly reminding everyone of the importance of long-term thinking, patience, and risk management.

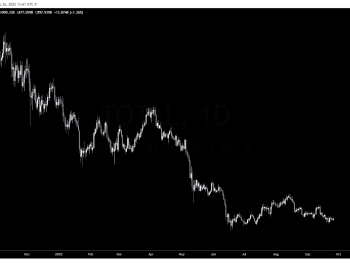
I have previously discussed and pointed out several Valuation Models for Bitcoin, attempting to establish buy-in prices. Today, I share with you an advancement on Bitcoin's Balanced Price, a model that attempts to calculate a fair value for Bitcoin using on-chain metrics, and overlaying it with a Difficulty Regression Model, which attempts to correlate the Balanced Price for the all-in cost to produce a Bitcoin.
By studying the chart, we can see that these two values intersect at approximately $17K. Mark this price level in your books. It is possible we are low enough that we do not plunge to $13K, and that the next capitulation event will drop us down to the true bottom at $17K. Only time will tell, but having these price levels ready and understanding market dynamics will boost your investment success significantly.
Altcoin Market Analysis
Large Increases in Open Interest:
Here we track altcoins on ByBit's Perpetual Swap Markets for tokens that have significantly increased in Open Interest. Such a rise indicates significant positioning by traders and likely profitable opportunities.
#1 ATOM
#2 NEAR
#3 BAL
#4 BCH
#5 HNT
#6 ENS
#7 1INCH
#8 MTL
#9 BSV
#10 CVX

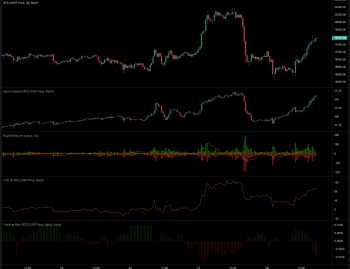
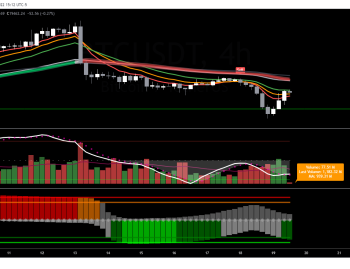
Applying our Pathways to Profit Trading Strategy and our Premium Indicator Suite, we notice that ATOM on the daily timeframe is trending above the Daily Base Line. Our momentum oscillator, Mynx, is trending above it's zero line and signal line. Our volatility indicator, Waddah Attar Explosion, is printing positive delta above a rising explosion level, and our confirmer Parallox is also trending above it's zero line. All metrics are fulfilled for a primary long. We are above the Base Line Qualifier Line, so reduced risk can reasonably be taken with this position.
Santiment does not track on-chain metrics for ATOM, so no insights can be gleaned from the network.

Drilling down into LTF data, we can see that ATOM is experiencing a consistent rise in Open Interest, showcased by our screener above. CVD is also consistently on the rise, indicating that buyers are in control. Funding is currently negative, so there are speculative short positions that just opened on this recent market top. We also just experienced a high level of short liquidations, so a pullback is likely at this point.
Conclusion:
ATOM is looking like a potential daily swing long. While we need to be cautious of Bitcoin plummeting and taking out the altcoin market, there is likely still a little alt rally left in the market. I would like to see an intra-day pullback in ATOM's price before entering into a long position, using our daily stop and target indicator: Quadrigo ATR.
Fin
Thank you for your support and for reading my Market Analysis. Please leave any questions, comments, or suggestions you have below.
If you're serious about a career in trading, and you want a no-nonsense approach to your education: join the Premium Trading Group! Learn how to build your own objective trading strategy from the ground up in our Online Trading Academy, improve your skills with our Premium Indicator Suite, learn from the best in our Mentoring Program, and enjoy our Private Discord Community.
You will also receive trading signals, portfolio recommendations, and more insights from our team of Analysts.